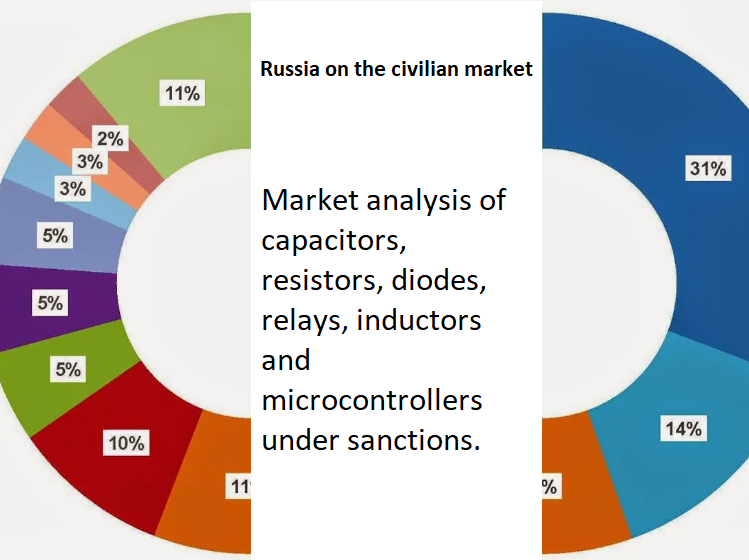
Market analysis of capacitors, resistors, diodes, relays, inductors and microcontrollers under sanctions
Dear readers, the article contains great number of figures. If something is unclear, be sure to write. Last year, my article in Russian “The market of electronic components and sanctions” was published. Since then, the situation has changed dramatically.
We will consider in this article what changes exactly have occurred.
It is important to note that the import of goods for 11 months of 2021 and 2022, without taking into account December, is compared.
There were no data for December at the time of writing the article. But, believe me, this will not affect the situation.
So, the evaluation of what we make. See Table 1.
Table 1. Customs codes by which we evaluate import.
| HS Code | Definition |
| 8532xxx* | Electrical capacitors, permanent, variable or adjustable. |
| 8533xxx** | Electrical resistors (including rheostats and potentiometers) |
| 8541xxx*** | Diodes, transistors and similar semiconductor devices |
| 85045xxx | Inductors and other chokes |
| 85364xxx | Relay |
| 8542319010 | monolithic integrated circuits (processors and controllers) |
| 8542339000 | Electronic integrated circuits: amplifiers, other |
*Except
*8532900000 Parts to capacitors
**8533900000 Parts for resistors, as well as supplies of various sensors.
***854141000х and 854140100х light-emitting diodes and photovoltaic cells. As well as 8541900000 parts of diodes, transistors.
Table 2 shows import for 11 months of 2021 and 2022, in money and in weight, as well as their ratios by year. IMPORTANT, all prices in the tables are given in FOB, usd. The weight in the tables is given in net, in kg.
Table 2. Import in monetary terms and in weight for 11 months.
| 2022 | 2021 | Ratio | ||||
| HS Code | Amount | Net weight | Amount | Net weight | 22/21 | 22/21 |
| 85045ххх | 41343151 | 1345505 | 44835554 | 1424688 | 0,92 | 0,94 |
| 8532хххх | 105121301 | 1467342 | 99395049 | 1731217 | 1,06 | 0,85 |
| 8533хххх | 42093661 | 987589 | 45943394 | 916281 | 0,92 | 1,08 |
| 85364ххх | 118195387 | 4892981 | 159240617 | 5043600 | 0,74 | 0,97 |
| 8541хххх | 143959730 | 365952 | 138767149 | 451569 | 1,04 | 0,81 |
| 8542319010 | 656609727 | 172947 | 382969595 | 184997 | 1,71 | 0,93 |
| 8542339000 | 71659434 | 7669 | 52615191 | 8642 | 1,36 | 0,89 |
| Grand total | 1178982391 | 9239985 | 923766549 | 9760997 | 1,28 | 0,95 |
If you look at import grand total for these codes, you can see that the total weight decreased by 10-15% for the liability, and by 5-10% for the asset. But in monetary terms, the total growth in liabilities is 0, and in assets it has increased.
Why did this happen?
I have a few suggestions.
1. The prices for materials have increased. This has led to an increase in prices from Chinese manufacturers by 10-15% during 2022. Now this process has stopped.
2. There are noticeable losses in project prices for major Western brands due to sanctions and suspension of supplies. But since the mass demand for them will continue for at least another 3-5 years, manufacturers are forced to buy them on the free market at a higher price. At the same time, the weight of the chips and demand in them remains the same.
3. I assume that manufacturing companies create stocks of those parts that they consider the rarest. This creates an increased demand for chips in 2022. A vivid example: Avtovaz, which stopped the conveyor in 2020 due to the huge shortage of just one chip.
4. It should be understood that the price of Chinese analogues in most cases will be lower. For example, not so long ago, a large company made a newsletter on Infineon MOSFET.I do not know at what prices this company bought them, but judging by the price list, it is significantly lower. Moreover, our company CompoNet(СЭлКом) also worked on Infineon MOSFET and replaced them with its own brand at a price twice as low. As you can see, in order to compensate for the drop in revenue, it is necessary to sell new MOSFET analogues three times more in unit and, accordingly, in weight value.
Previously, manufacturers from China accounted for a small share of products (in monetary terms). Now they have increased supplies tenfold, for example, for microcontrollers, an increase has been 50 times. Our company CompoNet(СЭлКом) has also found a Chinese manufacturer of ST analogues. Ask, in most replacements it will not be possible to re-install the board, although reprogramming will be required. I note that our price is significantly lower than the market price for ST, and the production time is only 4-5 weeks.
I am sure that after the sale of warehouses with European brands and after replacing them with Chinese brands, our market will significantly decrease in monetary terms. I repeat, we are talking only about the civil component. In the regulated/state market, there is likely to be growth in monetary terms.
But now, in general, due to several factors: inflation, material prices increase, changes in the exchange rate of the yuan, old and new stocks, growing prices from Chinese manufacturers and others, our market has not decreased in monetary terms. It even managed to grow by 20-30% compared to 2021. But all this is solely due to the increase in the price of purchased components and stocks that manufacturers form at their own place. These are the components that they consider key ones. I assume that there will be a drop next year, since in unit terms our market has undoubtedly decreased by 10-15%. However, formally, if your revenue grew by less than 15%, you lost market share.
Let’s look at the data shown in Table 2 in more detail.
8532ххх
Now it’s history. But if you are interested, you can find on the website and read some of my old articles about the capacitor market. In general, the capacitor market has never been strongly tied to Western brands, such as, for example, the microcontroller market. They are very easy to be replaced with supplies from other regions.
This code includes several customs codes, see Table 3.
Table 3. What does customs code 8532ххх include
| HS Code | Definition |
| 8532100000 | Power capacitors |
| 8532210000 | Constant capacity tantalum capacitors |
| 8532220000 | Permanent capacitors, aluminum electrolytic |
| 8532230000 | Ceramic single-layer capacitors of constant capacity |
| 8532240000 | Ceramic multilayer capacitors of constant capacity. |
| 8532250000 | Permanent capacitors with paper or plastic dielectric |
| 8532290000 | Other capacitors of constant capacity |
| 8532300000 | Capacitors of variable capacity or adjustable |
The following Table 4 shows data on the import of all codes from Table 3.
Table 4. Import by all codes from the group 8532xxx.
| 2022 | 2021 | Ratio | ||||
| HS Code | Amount, FOB usd | Net weight, kg | Amount FOB usd | Net weight, kg | 22/21 | 22/21 |
| 8532100000 | 3052216 | 221869 | 7619808 | 375546 | 0,40 | 0,59 |
| 8532210000 | 16006606 | 9920 | 11630426 | 12501 | 1,38 | 0,79 |
| 8532220000 | 25262270 | 529044 | 23374410 | 551083 | 1,08 | 0,96 |
| 8532230000 | 3608342 | 14148 | 2631078 | 20384 | 1,37 | 0,69 |
| 8532240000 | 37993588 | 102653 | 34522104 | 128886 | 1,10 | 0,80 |
| 8532250000 | 10840553 | 394088 | 11242328 | 453722 | 0,96 | 0,87 |
| 8532290000 | 7037437 | 180473 | 7210164 | 171878 | 0,98 | 1,05 |
| 8532300000 | 1346151 | 15218 | 1164731 | 17218 | 1,16 | 0,88 |
| Grand total | 105147162 | 1467412 | 99395049 | 1731217 | 1,06 | 0,85 |
Capacitors are a stock assortment. In the civilian market, no one is afraid of imposed sanctions. Let me remind you that in the article I do not take into account the factors affecting dual-use or military components. In capacitors, my theory of price growth is quite well traced. 10-15% growth is an increase in producer prices. The rest is the price increase due to the change of supply channels. Example: ceramic multilayer capacitors. The overwhelming market share for them is held by two companies YAGEO and SAMSUNG. That is why the increase in costs for them is minimal. Aluminum capacitors are, first of all, Eastern countries. Tantalums are, first of all, Western brands. Compare their data by the ratio of 22/21.
If you read my last article, you know that at the time of writing, the drop of import was 50%. But, since then, suppliers have recovered from the shock, rebuilt supply channels, found new brands. In fact, the influence of European and American globalization has been greatly overestimated, both on the world and on the Russian market. Our Russian distributors have experienced so many shocks over the past 20 years. This allowed them to make quick, though sometimes very painful decisions. As a result, the import quickly recovered and made up for lost time. But I repeat, all of the above concerns the civilian market. See Table 5, where it is clearly visible that since August, the market has been increasing supplies.
Table 5. Import by code 8532 xxx to Russia by month.
| 2022 | Amount | % by year |
| Jan | 10472357 | 10,0 |
| Feb | 9439785 | 9,0 |
| Mar | 5704819 | 5,4 |
| Apr | 5461043 | 5,2 |
| May | 7138858 | 6,8 |
| Jun | 7813546 | 7,4 |
| Jul | 8063803 | 7,7 |
| Aug | 11445244 | 10,9 |
| Sep | 12924622 | 12,3 |
| Oct | 12961530 | 12,3 |
| Nov | 13721554 | 13,0 |
The following Table 6, which is probably the most interesting and will cause controversy among readers, presents the top brands of the capacitor components market.
Table 6. Import of brands that are known in the components market.
| 2022 | 2021 | Ratio | ||||
| Manufacturer | Amount | Net weight | Amount | Net weight | 22/21 | 22/21 |
| AVX/ATC/KYOCERA | 10668552 | 10498 | 10360571 | 30211 | 1,03 | 0,35 |
| YAGEO/KEMET | 9856879 | 37394 | 9671228 | 67530 | 1,02 | 0,55 |
| MURATA | 7455876 | 13134 | 6491556 | 24374 | 1,15 | 0,54 |
| EPCOS/TDK | 5404484 | 95013 | 8474082 | 244892 | 0,64 | 0,39 |
| SAMSUNG | 6262524 | 20660 | 7513621 | 34541 | 0,83 | 0,60 |
| VISHAY | 5180990 | 23256 | 4731367 | 32085 | 1,10 | 0,72 |
| PANASONIC | 4638404 | 15196 | 3396423 | 33283 | 1,37 | 0,46 |
| SAMWHA | 1221135 | 39000 | 3025696 | 97259 | 0,40 | 0,40 |
| HITANO | 1694682 | 36641 | 1474290 | 27010 | 1,15 | 1,36 |
| AIHUA | 1678571 | 57746 | 1465526 | 46609 | 1,15 | 1,24 |
| WALSIN | 1043065 | 8546 | 1467381 | 14619 | 0,71 | 0,58 |
| JB CAPACITORS | 1343174 | 58838 | 1052796 | 55541 | 1,28 | 1,06 |
Don’t let different ratios bother you. The thing is that all imports were presented in the previous tables, but here only by brand. The brands were chosen by me based on their popularity in the market or my experience working with them. The price-to-weight ratios for the eastern brands SAMSUNG, SAMWHA, WALSIN, HITANO, JB are about the same. At the same time, the increase in the volume of import roughly corresponds to the price increase. The increase in import weight is almost equal to the increase in price. But for Western brands, not everything is so clear. The drop in weight is very significant, i.e. if necessary, these brands can be brought to Russia, but this will be associated with a significant price increase.
To make my previous statement not unfounded, I will give in the following tables the data of two brands MURATA and EPCOS/TDK by month.
Table 7. MURATA imports in 2022 by month.
| Manufacturer | Month | Amount | Net weight |
| MURATA | Jan | 779650 | 1538 |
| Feb | 700615 | 3284 | |
| Mar | 219643 | 887 | |
| Apr | 388335 | 998 | |
| May | 634222 | 945 | |
| Jun | 792119 | 739 | |
| Jul | 499380 | 649 | |
| Aug | 534042 | 468 | |
| Sep | 990944 | 908 | |
| Oct | 539259 | 896 | |
| Nov | 1377667 | 1824 | |
| Grand total | 7455876 | 13134 |
MURATA data taken without supplies to LG factories.
Table 8. EPCOS/TDK import in 2022 by month.
| Manufacturer | Month | Amount | Net weight |
| EPCOS/TDK | Jan | 1064506 | 42214 |
| Feb | 857248 | 25074 | |
| Mar | 180045 | 3393 | |
| Apr | 151063 | 751 | |
| May | 331030 | 10212 | |
| Jun | 357325 | 1591 | |
| Jul | 499848 | 1912 | |
| Aug | 476691 | 2739 | |
| Sep | 315901 | 1055 | |
| Oct | 401616 | 2905 | |
| Nov | 769212 | 3166 | |
| Grand total | 5404484 | 95013 |
In general, you can bring everything, if it is not a dual-use position. Our civilian electronic components market, which accounts for 0.5% of the global market, is simply a statistical error. That’s why no one will even notice if half a billion conventional capacitors go to Russia.
Our businessmen with extensive experience, which they managed to accumulate during the crises, rebuilt everything very quickly. The only question is the price for the consumer. If the price suits, we will deliver it. Tables 7 and 8 confirm this.
I will not point out a specific European brand and cost. I will only give the ratio of deliveries by country of departure.
Table 9. % of 100% for the 7 largest countries of departure for 2021-2022 years.
| 2022 | 2021 | |||
| Country | Amount | Net weight | Amount | Net weight |
| Germany | 26,03 | 54,96 | 50,32 | 74,08 |
| China | 42,88 | 24,58 | 3,29 | 3,61 |
| Hong Kong | 19,79 | 10,30 | 8,42 | 6,78 |
| Estonia | 1,91 | 0,18 | 15,80 | 0,32 |
| Lithuania | 5,38 | 8,01 | 8,04 | 11,67 |
| Belgium | 2,69 | 1,66 | 7,11 | 2,37 |
| USA | 1,31 | 0,30 | 7,02 | 1,16 |
| 100,00 | 100,00 | 100,00 | 100,00 | |
The conclusions are obvious. After almost a year, we can safely say that if these are not dual-use products, anything will be delivered. You just need to be satisfied with the price of the free market and the non-guaranteed delivery time. This is very important dear consumer, if your supplier guarantees you the delivery and price within a year, he/she is just lying about what to do, sign the contract, but be sure to have a plan B.
Moreover, this statement – we will deliver everything – concerns even specific-niche chips, such as those of the manufacturer Maxim Integrated, which is one of the leaders of innovative products and manufactures many new products every year. Despite the fact that distribution supply channels are blocked, it is possible to buy microchips, but significantly more expensive. See Table 10.
Table 10. Import of Maxim by year.
| Maxim | ||
| mln, usd | Net weight | |
| 2021 | 13,1 | 6600,00 |
| 2022 | 19,3 | 4300,00 |
The conclusion is simple, we delivered, but about 2 times more expensive than the prices of former distributors.
8533ххх
Now let’s consider, most likely, the most sanctions-resistant part of the component market.
Table 11 shows the definition of the customs codes included in the code 8533. Table 12 shows import data.
Table 11. Definition of customs codes included in code 8533
| HS Code | Definition |
| 8533100000 | Permanent carbon, composite or film resistors |
| 8533210000 | Permanent resistors with a power of no more than 20 W |
| 8533290000 | Other permanent resistors |
| 8533310000 | Variable wire resistors, rheostats, potentiometers, not more than 20 W |
| 8533390000 | Other variable wire resistors, including rheostats and potentiometers |
| 8533401000 | Other variable resistors, including rheostats and potentiometers, not more than 20 W |
| 8533409000 | Other variable resistors, including rheostats and potentiometers |
Table 12. Import by all codes from the group 8533xxx.
| 2022 | 2021 | Ratio | ||||
| HS Code | Amount | Net weight | Amount | Net weight | 22/21 | 22/21 |
| 8533100000 | 14123878 | 132015 | 13862996 | 143298 | 0,98 | 1,09 |
| 8533210000 | 6637497 | 62822 | 6973760 | 74907 | 1,05 | 1,19 |
| 8533290000 | 6762762 | 361174 | 9534624 | 418783 | 1,41 | 1,16 |
| 8533310000 | 789913 | 6661 | 1507467 | 12459 | 1,91 | 1,87 |
| 8533390000 | 1518702 | 168149 | 1192041 | 95814 | 0,78 | 0,57 |
| 8533401000 | 9270333 | 197699 | 9342377 | 119505 | 1,01 | 0,60 |
| 8533409000 | 2990576 | 59069 | 3530129 | 51515 | 1,18 | 0,87 |
| Grand total | 42093661 | 987589 | 45943394 | 916281 | 1,09 | 0,93 |
Unfortunately, it will not be possible to take the first 10 brands on resistors. The thing is that today a large number of products based on them are imported. Cleaning the base for 2 years is a very painstaking task. So I’ll just show the brands I know. See Table 13.
Table 13 Import of brands that are known in the components market.
| 2022 | 2021 | Ratio | ||||
| Manufacturer | Amount | Net weight | Amount | Net weight | 22/21 | 22/21 |
| EPCOS/TDK | 1622169 | 20801 | 2705255 | 60470 | 0,60 | 0,34 |
| YAGEO/KEMET | 2893361 | 40751 | 2735567 | 34622 | 1,06 | 1,18 |
| FENGHUA | 1541719 | 25525 | 789474 | 21724 | 1,95 | 1,17 |
| WALSIN | 912532 | 13667 | 792959 | 14477 | 1,15 | 0,94 |
| RUICHI | 223864 | 9283 | 222973 | 9399 | 1,00 | 0,99 |
| THINKING | 299663 | 6532 | 466362 | 8546 | 0,64 | 0,76 |
| KLS | 243494 | 7970 | 163217 | 6330 | 1,49 | 1,26 |
| VIKING | 494042 | 5320 | 186529 | 4683 | 2,65 | 1,14 |
| VISHAY | 2715345 | 3285 | 2871384 | 6428 | 0,95 | 0,51 |
| BOURNS | 2020314 | 4117 | 1836606 | 4809 | 1,10 | 0,86 |
| SAMWHA | 46563 | 1764 | 122062 | 4799 | 0,38 | 0,37 |
Dear readers, if we take only these brands that are undoubtedly familiar to you, then the average values will be as follows: 1.18 import growth in usd22/21, and 0.87 product weight ratio.
8541xxx
Now let’s consider the customs code 8541 and its component. See Table 14.
Table 14. Definition of customs codes included in code
| HS Code | Definition |
| 854110000х | Diodes, except photodiodes and light-emitting diodes |
| 8541210000 | Transistors, except phototransistors with a dissipation power of less than 1 W |
| 8541290000 | Other transistors, except phototransistors |
| 8541300009 | Thyristors, dinistors and trinistors, except photosensitive devices, other |
| 8541600000 | Piezoelectric crystals assembled |
Table 15. Import by all codes from group 8541 xxx.
| 2022 | 2021 | Ratio | ||||
| HS Code | Amount | Net weight | Amount | Net weight | 22/21 | 22/21 |
| 854110000х | 39297614 | 135876 | 35305592 | 148051 | 1,11 | 0,92 |
| 8541210000 | 9933848 | 17590 | 7000037 | 27108 | 1,42 | 0,65 |
| 8541290000 | 55610350 | 116113 | 58886695 | 171270 | 0,94 | 0,68 |
| 8541300009 | 7491365 | 64194 | 7929168 | 60921 | 0,94 | 1,05 |
| 8541600000 | 15232669 | 23695 | 19445607 | 28913 | 0,78 | 0,82 |
| Grand total | 127565846 | 357468 | 128567100 | 436263 | 0,99 | 0,82 |
Since under the code 8541 there are two components that differ in functionality: diodes and quartz, I decided to divide these brands into two tables. The first, Table 16, will be devoted to 8541600000 quartz, the second, Table 17 – to all the rest.
Table 16 Import of brands that are known in the components market, by code 8541600000.
| 2022 | 2021 | Ratio | ||||
| Manufacturer | Amount | Net weight | Amount | Net weight | 22/21 | 22/21 |
| NDK | 2402668 | 1495 | 4812856 | 1532 | 0,50 | 0,98 |
| DAISHINKU | 857558 | 195 | 1369529 | 261 | 0,63 | 0,75 |
| ABRACON | 1018863 | 512 | 944929 | 540 | 1,08 | 0,95 |
| GEYER | 429234 | 1109 | 1005251 | 2739 | 0,43 | 0,40 |
| CRYSTAL TECHNOLOGY | 556855 | 2466 | 823171 | 3703 | 0,68 | 0,67 |
| EPSON | 413301 | 169 | 714359 | 342 | 0,58 | 0,49 |
| Microchip/MICROSEMI | 171165 | 29 | 590756 | 49 | 0,29 | 0,59 |
| MICRO CRYSTAL | 276620 | 163 | 377374 | 304 | 0,73 | 0,54 |
| MURATA | 188869 | 319 | 351836 | 951 | 0,54 | 0,34 |
| TXC CORPORATION | 181853 | 83 | 254206 | 116 | 0,72 | 0,72 |
| RAKON | 6900 | 0 | 398729 | 19 | 0,02 | 0,02 |
RAKON has completely stopped its supplies. But if there is a gap, something will fill it. Two companies stand out against the background of the data: NDK and Microchip/MICROSEMI. It is embarrassing that they imported significantly less goods at cost than before.
There are four possible reasons:
1. Significant improvement in price conditions, which is unlikely.
2. Companies or market players, freed from obligations, buy significantly cheaper on the free market. Most manufacturers attribute Russia to the European market with a higher price. Sometimes the differences are very significant.
3. Companies began to sell more mass quartz, such as HC49. They weigh a lot, but are cheaper.
4. Other brands, nameless China, are imported under these brands. But this reason is also unlikely.
Most likely, the first three options are correct. They are superimposed on each other to varying degrees.
What do you think?
Table 17. Import of brands known in the component market by code 8541, except 8541600000
| 2022 | 2021 | Ratio | ||||
| Manufacturer | Amount | Net weight | Amount | Net weight | 22/21 | 22/21 |
| INFINEON/IR | 18480912 | 23020 | 21835863 | 38271 | 0,85 | 0,60 |
| NXP/Freescale | 9622716 | 8333 | 5946954 | 15183 | 1,62 | 0,55 |
| ON SEMI | 7375406 | 9562 | 7165611 | 20738 | 1,03 | 0,46 |
| STM | 6857976 | 9244 | 6203040 | 19974 | 1,11 | 0,46 |
| VISHAY | 6276117 | 11826 | 4842087 | 17062 | 1,30 | 0,69 |
| INTEGRA TECH | 6772041 | 154 | 4252665 | 123 | 1,59 | 1,25 |
| MITSUBISHI | 2054819 | 5027 | 4674794 | 15502 | 0,44 | 0,32 |
| SEMIKRON | 1916176 | 8923 | 4615417 | 28480 | 0,42 | 0,31 |
| MACOM | 3185148 | 160 | 2079749 | 183 | 1,53 | 0,88 |
| ABB | 1339120 | 1931 | 3896520 | 5443 | 0,34 | 0,35 |
| Microchip/MICROSEMI | 1981197 | 1009 | 2415094 | 606 | 0,82 | 1,67 |
| DIODES | 2427469 | 3358 | 1848474 | 4482 | 1,31 | 0,75 |
| IXYS | 946706 | 1675 | 1905012 | 8499 | 0,50 | 0,20 |
It is interesting that Microchip/MICROSEMI also shows the same result, in proportions of years 22/21. This suggests that the second option is likely to have the greatest impact. But still, anyway, Microchip is a Western brand. Its future in terms of supplies is not guaranteed, since everyone who will guarantee the supplies to you throughout the year is really doing it at their own risk, sign contracts to avoid verbal problems.
As you can see, the import of diodes, in general, has fallen significantly. But the drop in quantity was offset by a strong increase in the price itself.
The electrical brand ABB was included in the table. I left it intentionally to show that approximately the same situation most likely exists in the markets related to us. The decline in it is simply huge. This is not surprising, since on July 21, 2022, the company announced its withdrawal from the market.
It is worth considering that Schneider Electric and Weidmuller have also closed their warehouses. Together with AB, they have occupied a huge market share. A colossal market share is cleared for Russian distributors and manufacturers of electrical products.
As for MITSUBISHI and SEMIKRON, it is worth saying that all their importers have dropped import volumes. But officially, these companies did not say that they were going to leave Russia.
Nevertheless, both ABB and MITSUBISHI and SEMIKRON are still imported to Russia, although not directly from the manufacturer. At the same time, November deliveries are significantly lower than last year’s. A similar situation has developed for STM with ON SEMI, as well as for other Western brands. You can buy it, but it is significantly more expensive than before.
85045хххх
I will not specifically dwell on this code, let the numbers speak for themselves.
Table 18. Definition of customs codes included in code 85045xxx
| HS Code | Definition |
| 8504502000 | Inductors and other chokes. Used with telecommunication equipment
and for power supplies of computers and their blocks |
| 8504509500 | Inductors and other chokes |
Table 19. Import for all codes from the group 85045xxx.
| 2022 | 2021 | Ratio | ||||
| HS Code | Amount | Net weight | Amount | Net weight | 22/21 | 22/21 |
| 8504502000 | 4862089 | 48774 | 3907606 | 56563 | 1,24 | 0,86 |
| 8504509500 | 36481062 | 1296732 | 40927949 | 1368126 | 0,89 | 0,95 |
| Grand total | 41343151 | 1345505 | 44835554 | 1424688 | 0,92 | 0,94 |
Table 20 Import of brands that are known in the component market by code 85045xxx
| 2022 | 2021 | Ratio | ||||
| Manufacturer | Amount | Net weight | Amount | Net weight | 22/21 | 22/21 |
| EPCOS/TDK | 2454658 | 10208 | 2242046 | 27764 | 1,09 | 0,37 |
| MURATA | 1944647 | 4201 | 2594746 | 6830 | 0,75 | 0,61 |
| BOURNS | 1663851 | 8098 | 2213772 | 18507 | 0,75 | 0,44 |
| WURTH ELEKTRONIK | 1372279 | 4266 | 1422617 | 9260 | 0,96 | 0,46 |
| COILCRAFT | 1657450 | 1770 | 1128275 | 1355 | 1,47 | 1,31 |
| SUNLORD | 709235 | 6835 | 1402630 | 12913 | 0,51 | 0,53 |
| VISHAY | 1029613 | 2970 | 1038439 | 4748 | 0,99 | 0,63 |
| PARACOM | 656492 | 76056 | 1163411 | 145666 | 0,56 | 0,52 |
| ABB | 1150248 | 44261 | 473362 | 17636 | 2,43 | 2,51 |
| FERRIWO | 665254 | 23606 | 644940 | 27492 | 1,03 | 0,86 |
| RUIKAI | 590634 | 107998 | 614780 | 125430 | 0,96 | 0,86 |
| SCHALTBAU | 605010 | 21995 | 473918 | 14693 | 1,28 | 1,50 |
85364хххх
If you have read my early article on relays, you know that the relay world belongs to the electrical market. Relays on the board, which are usually sold on the component market, occupy the last positions in the relay world in terms of money.
Table 21. Definition of customs codes included in code 85364xxx
| HS Code | Definition |
| 8536411000 | Relay for a voltage of not more than 60 V, for a current of not more than 2 A |
| 8536419000 | Relay for a voltage of not more than 60 V, for a current of more than 2 A |
| 8536490000 | Other relays, for a voltage not exceeding 1000 V |
Table 22. Import by all codes from group 85364xxx.
| 2022 | 2021 | Ratio | ||||
| HS Code | Amount | Net weight | Amount | Net weight | 22/21 | 22/21 |
| 8536411000 | 10901220 | 76017 | 11304928 | 88227 | 0,96 | 0,86 |
| 8536419000 | 24647634 | 623532 | 39496741 | 1084584 | 0,62 | 0,57 |
| 8536490000 | 82646533 | 4193431 | 108439226 | 3870800 | 0,76 | 1,08 |
| Grand total | 118195387 | 4892981 | 159240896 | 5043611 | 0,74 | 0,97 |
Note that the total cost of the relays has decreased, while their weight is the same. This suggests that domestic consumers have decided to switch to inexpensive Chinese brands. My company CompoNet(СЭлКом) was also lucky in this regard. We have a Chinese brand proven by a decade of cooperation. You can feel free to contact us.
Table 23. Import of brands that are known in the component market by code 85364xxx
| 2022 | 2021 | Ratio | ||||
| Manufacturer | Amount | Net weight | Amount | Net weight | 22/21 | 22/21 |
| SCHNEIDER | 5478026 | 99455 | 18143387 | 573664 | 0,30 | 0,17 |
| TE CONNECTIVITY | 4534652 | 51738 | 10642220 | 174430 | 0,43 | 0,30 |
| IEK | 7193883 | 699162 | 4119836 | 435582 | 1,75 | 1,61 |
| ABB | 2739285 | 25818 | 8177800 | 89394 | 0,33 | 0,29 |
| OMRON | 4128261 | 72078 | 6747803 | 129266 | 0,61 | 0,56 |
| HONGFA | 5969309 | 95382 | 4331672 | 112436 | 1,38 | 0,85 |
| SIEMENS | 1576279 | 14630 | 7298303 | 83695 | 0,22 | 0,17 |
| EKF | 5641290 | 463534 | 2892837 | 236588 | 1,95 | 1,96 |
| CHINT ELECTRICS | 5050854 | 431378 | 2675576 | 256357 | 1,89 | 1,68 |
| DANFOSS | 1109579 | 16268 | 3918903 | 50189 | 0,28 | 0,32 |
| FINDER | 963821 | 9571 | 3938370 | 44390 | 0,24 | 0,22 |
| PHOENIX | 1214061 | 9648 | 3272340 | 21493 | 0,37 | 0,45 |
| NCR | 2361912 | 76795 | 1958875 | 71457 | 1,21 | 1,07 |
| LEACH INTERNATIONAL | 1752281 | 390 | 2280804 | 518 | 0,77 | 0,75 |
8542319010
Monolithic integrated circuits (processors and controllers)
So we got to the most interesting key code, the heart of the development.
Table 24. Import by code 8542319010
| 2022 | 2021 | Соотношение | ||||
| HS Code | Amount | Net weight | Amount | Net weight | 22/21 | 22/21 |
| 8542319010 | 671625970 | 177776 | 387259138 | 186935 | 1,73 | 0,95 |
Table 25. Import by month by code 8542319010
| 2022 | 2021 | |||
| Date | Amount | Net weight | Amount | Net weight |
| Jan | 40224316 | 18948 | 30709145 | 13612 |
| Feb | 38439813 | 20192 | 25431771 | 14929 |
| Mar | 18621210 | 6287 | 29349466 | 17246 |
| Apr | 19096929 | 4335 | 34380615 | 18676 |
| May | 48729316 | 10542 | 37315256 | 18738 |
| Jun | 57643178 | 8857 | 29119956 | 17954 |
| Jul | 81000573 | 15330 | 35120506 | 17314 |
| Aug | 83209920 | 18264 | 38388065 | 19120 |
| Sep | 92343012 | 27173 | 37049734 | 15523 |
| Oct | 102176658 | 24395 | 43022467 | 15409 |
| Nov | 90141044 | 23453 | 47372156 | 18413 |
| Grand total | 671625970 | 177776 | 387259138 | 186935 |
Cargo in 2021 arrived in Russia very evenly. And in 2022, after the failure in March-June, the importers, having rebuilt supply channels, quickly caught up, and satisfied the deferred demand.
Table 26 Import of brands that are known in the component market, by code 8542319010
| 2022 | 2021 | Ratio | ||||
| Manufacturer | Amount | Net weight | Amount | Net weight | 22/21 | 22/21 |
| INTEL | 298842656 | 83446 | 124592331 | 71216 | 2,40 | 1,17 |
| AMD | 48651306 | 21053 | 35501092 | 31313 | 1,37 | 0,67 |
| STM | 39329022 | 6753 | 30829314 | 9047 | 1,28 | 0,75 |
| Microchip/Atmel | 40078967 | 7846 | 24036374 | 9071 | 1,67 | 0,86 |
| TEXAS | 21680378 | 3981 | 15059918 | 5601 | 1,44 | 0,71 |
| NXP/Freescale | 13725314 | 3209 | 12163717 | 6818 | 1,13 | 0,47 |
| AD/MAXIM | 14201361 | 1013 | 6271331 | 1165 | 2,26 | 0,87 |
| INFINEON/IR | 7178816 | 1426 | 9566828 | 3663 | 0,75 | 0,39 |
| SAMSUNG | 1615095 | 291 | 9244735 | 1427 | 0,17 | 0,20 |
| BROADCOM/AVAGO | 6697388 | 248 | 2016413 | 322 | 3,32 | 0,77 |
| ALTERA | 3834566 | 377 | 539928 | 139 | 7,10 | 2,72 |
| SILICON | 2002681 | 239 | 1382632 | 436 | 1,45 | 0,55 |
| XILINX INC | 1453851 | 23 | 1486209 | 34 | 0,98 | 0,67 |
| Renesas/IDT | 1905866 | 596 | 576537 | 346 | 3,31 | 1,72 |
| CYPRESS | 1601505 | 180 | 848221 | 364 | 1,89 | 0,49 |
It is interesting that INTEL and AMD continue to be supplied in Russia, but both brands have become twice as expensive. This indicates the loss of direct procurement supplies through distributors. Such an increase in prices cannot be attributed to additional logistics. Microcontrollers or processors are project sales at project prices. It is clear from all Western brands that the free market has not yet recovered from the deficit. That’s why necessity makes buying more expensive.
For example, our client uses a Microchip microcontroller, which he has bought from an official distributor for a long time. In conditions of a shortage of chips, increasing prices, the probability of our delivery to its production was equal to 0. The used microcontroller is not so popular. It is on the market, but there is no surplus to reduce the market value.
Now, the consumer buys it from the company that offers the best price. But at the same time, everyone’s price is three times higher than before, when he bought it from a distributor. And we have even installed MK from Microchip once.
Recently, inexpensive Chinese ST analogues have appeared in our line, quite a worthy competitor of the companies Nations, Artery, GigaDevice or Geehy. Of course, we decided to offer MK to the customer. But the customer can’t decide to change the main board yet. I am sure that in the future he will definitely leave Microchip. And there are three reasons. The first one is economic. The difference in cost is $1.5. The second one is logistical. Now free market cannot guarantee price stability and availability stability in the free market. Fluctuations are up to 50% of the price. Therefore, the manufacturer has to make stocks. The third reason is geopolitical, the supply of MK Microchip cannot be generally guaranteed, even to China, since China is now under the strongest pressure and semiconductor confrontation with the West.
8542339000
And the last code is the various amplifiers. In Table 27, out of the many brands, those ones that are familiar to me were highlighted.
Table 27. Import by code 8542339000
| 2022 | 2021 | Ratio | ||||
| HS Code | Amount | Net weight | Amount | Net weight | 22/21 | 22/21 |
| 8542339000 | 73910465 | 7690 | 52615191 | 8642 | 1,40 | 0,89 |
Table 28 Import of brands that are known in the component market by code 8542339000
| 2022 | 2021 | Ratio | ||||
| Manufacturer | Amount | Net weight | Amount | Net weight | 22/21 | 22/21 |
| AD/MAXIM | 27339450 | 1958 | 15597136 | 2011 | 1,75 | 0,97 |
| TEXAS | 9961140 | 2065 | 9184616 | 2856 | 1,08 | 0,72 |
| UMS | 3308668 | 35 | 3696943 | 34 | 0,89 | 1,02 |
| NEDI TECHNOLOGY | 3447028 | 45 | 1963703 | 17 | 1,76 | 2,72 |
| QORVO | 2424817 | 162 | 2494733 | 140 | 0,97 | 1,16 |
| METDA | 2568912 | 11 | 1656338 | 7 | 1,55 | 1,70 |
| Microchip/Atmel/MICROSEMI | 1337787 | 315 | 1567687 | 379 | 0,85 | 0,83 |
| BROADCOM/AVAGO | 1068698 | 112 | 1778196 | 138 | 0,60 | 0,81 |
| SUMITOMO | 1119112 | 117 | 1468210 | 127 | 0,76 | 0,92 |
| COMPOUND PHOTONICS | 1274631 | 3 | 378631 | 6 | 3,37 | 0,46 |
| MINI-CIRCUITS | 1031992 | 112 | 614995 | 145 | 1,68 | 0,77 |
| NXP/Freescale | 1151392 | 69 | 385707 | 73 | 2,99 | 0,94 |
How will Compel or Symmetron differ from our company CompoNet(СЭлКом) or Equant in 2024? There will be no difference, except for the presence of a warehouse, financial power and, undoubtedly, fame and reputation. Otherwise, everyone will be equal. In 2-3 years, we will be trading, perhaps even at the same prices. But we are guaranteed to develop Chinese brands together. Even if everything goes back to normal, I am sure that any developer, under equal conditions, will choose a Chinese brand, not a European one. And this is despite the fact that just a year ago, the European brand had every chance to win even at double price.
Almost all major players in the components market have reduced their staff by 15-50%. Many companies have completely abandoned regional offices. A new story awaits us all. I see only one unpleasant moment here.
Why did all distributors adore European brands? Because the quality was guaranteed. It’s obvious. But there was another secret motive. Western brands protected their distributors, with rare exceptions, by not selling goods directly to Russian manufacturers. Therefore, now the history of the component market is beginning to be written from scratch.
We in Russia are no stranger to it. The inflationary crisis that is currently raging in Europe has been raging continuously in Russia, subsiding or growing, since 1991. Agree, those who are now younger than 40, do not understand this. But the crisis of the 90s, which many current managers and owners of companies have experienced, has been a hurricane. It swept away the entire economy. Compared to this, the current hurricane seems to be a strong wind. At least at the moment.
I will give an example for those who are not 40 years old yet. I’ll just say that my grandfather worked at Moskvich Moscow Automobile Plant, the one that is now being planned to be brought back to life. He worked as an engineer and was paid by carts. Just imagine, you work at a factory or for a distributor, and they give you a salary with capacitors.
The Russian ruble has never been as stable as European currencies. Russian distributors did not export Russian semiconductors. Many companies have already cut employees very much. Many companies lost distribution, large customers. Sales fell to 50% of revenue. For us, this has become not the norm, but familiar difficulties. If we take into account our market share in the global market, we can say with confidence that our civilian semiconductor market will survive this crisis as well.
Based on the figures given in the article , conclusions can be drawn.
The conclusions:
1. You can buy, at a more expensive price, but you can. The only problem is that since the supply channel is indirect, it is impossible to guarantee the timing and schedule deliveries. That is why manufacturers, who for one reason or another cannot abandon Western components, are forced to make serious stocks in their own warehouses or in the warehouses of the suppliers. The price is also not guaranteed. Its volatility can fluctuate very much during the year.
2. Depending on the family, selling prices from manufacturers in the world increased by 10-30% in 2021-2022. Plus the loss of project prices. Plus a shortage of components. Therefore, in 2022, our market has not declined in monetary terms. I am very confident that some of the purchases, especially for microchips, were made for the future. All this hid the real state of affairs.
My verdict is extremely simple. In monetary terms, the market has resisted and even increased by 15-25%. But this is not a real increase in production. In quantitative terms, the market has rather shrunk by 10-15%.
There will be a reduction in 2023. The monetary component will also begin to shrink. But it will decline not only because of falling prices and possible deficit reduction. I do not believe that in 2023 it will be possible to significantly reduce the shortage of chips. Perhaps this will happen in 2024, but not earlier.
The fall will be more prosaic. The decline in monetary terms will occur due to the transition to Chinese brands. This will lead to a reduction in the cost of components in the product, since Western components will be strongly displaced from there. And this, I believe, is the inevitable future for those developers and owners who are used to planning everything in advance. As they say: “Take care of yourself and God will take care of you”.
This is good for competition and cost. But this means that even if the economy grows, the monetary component of the component market will not grow. And if the deficit ends in 2024, then the next 2-3 years we are likely to have business depression.