Why Individual Analysis Is So Important
The article was published in “KOMPONENTY I TEKHNOLOGII” magazine • #7, 2019
The Customs Service has been publishing export and import information for a few years. When purchasing production lots, customers can be sure that the declaration is authentic: diodes have been imported, not potatoes. For “fair” companies it is a great benefit but there are always some additional opportunities, like in any sphere. For example, analyzing data and taking advantage of it for your business.
Brand managers or just ordinary employees often need to have field-specific market statistics. Not all of them and not always, of course. Here, internal motivation and result orientation play a critical part. If your staff members receive fixed salary or you set a ceiling for them, you can hardly expect them to be eager to improve their knowledge or strive for professional growth. If your company adheres to the unspoken rule that the director earns more than anyone else, the company is sure to be lacking motivation.
How can you benefit from your employees’ ability to perform analysis based on the internal market information? At least, you will have a foundation for long-term planning or a clearer idea of your goal which will be taken into account when analyzing the final working results. The data obtained will indicate the aspects you will then be able to take under control to ensure proper company management.
Indeed, there are interesting and full-fledged methodologies for market analysis on the Internet.
Russian: Research conducted by the Information and Analysis Center of Modern Electronics (SOVEL, Ltd.).
Foreign: Global Thin Film Resistors Market Research Report 2018.
Lots of business managers buy or order ready-made reports from specialized companies but, to my surprise, almost all managers do not provide any statistics based on those analyses, they do not prepare any presentations or hold any meetings – in other words, they do not share the information with the staff.
I sometimes ask my colleagues from other companies about internal analysis results. And almost always all they get is final figures. Most employees follow instruction from their superiors. In the best case scenario, they have access to customer-based sales analysis results. As a result, their activities lack consistency and orderliness as analysis is a key factor when doing business.
For example, I faced a serious problem during a recent ceramic capacitors allocation. I needed to estimate the degree of impact the allocation had on the product availability in the market.
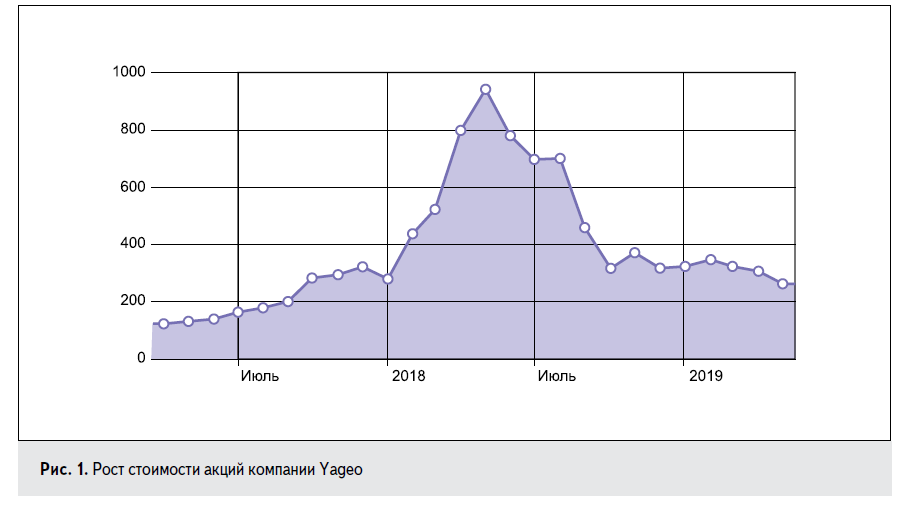
Everybody is aware of the situation with ceramics in 2018. Now, I am going to express my own particular opinion. The “mess” (which is the only suitable word to describe the situation) was initiated by Yageo. At that time and five years before the allocation I was dealing with the brand, participated in it from the very beginning and saw how the situation developed from scratch. Yageo’s behavior was abnormal. Its activities were beyond the business framework. And when I saw Yageo’s stock value growing (Fig. 1), I realized there was a foul play.

Fig. 1 Growing value of Yageo’s stocks
And since Yageo is the leader in the ceramic capacitor market, holding the third position in the world… So, nothing can be proved but you see what it is all about…
Yageo’s actions made the terms of ceramics production in other places grow up to a year. Other companies started raising prices too. Manufacturers and distributors tripled the amounts they ordered.
Soon, ceramics production time reached two years. Manufacturers just stopped accepting orders which caused panic.
I have nothing on Yageo. It was the company’s own business and everyone who managed to see how the wind was blowing, made money from the allocation. Everyone except consumers. And, of course, Murata, whose managers resisted the temptation of making superprofit and just enlarged their market share.
The growth of other MLCC manufacturers’ stock value can be seen in Fig. 2–4.
Fig. 2 Growing value of Murata Manufacturing Co’s stocks. Fig. 3 Growing value of Viking Tech
Corporation’s stocks.
Fig. 4 Growing value of Taiyo Yuden Co’s stocks
All of them had their stocks climbing but Yageo bosses ate the ginger. I do not state that there was no problem at all, but the Taiwanese manufacturer’s behavior aggravated the situation considerably turning it into a large soap bubble. And what happened next?
The prices grew by three times at least. All companies, including us, raised prices of old stocks. The sales growth and profit margin skyrocketed in all companies. Generally, I felt great because I was among the first of those who smelled a rat. We got ready in time and stocked at the lowest prices. But…
1. Was it the right decision to raise prices by several times relative to purchase ones? What is the right answer if prices differ by five times even within a single brand in10 different suppliers or within 10 different brands?
2. How can the reference point be determined? Analyzing purchases or sales in monetary terms is pointless as the result may vary by 200%.
I found the decision: analyzing ceramics based on its weight. The result proved our main concern to be true: we set the price and make a purchase two or even three times higher due to the shortage of the goods. In fact, there is some ceramics available in the market but it is overpriced.
But those who need capacitors, find ceramics and import it with 18% VAT.
Fig. 5 shows data by months in 2017-2019.

Fig. 5 Data on ceramic capacitors imported to Russia, by weight
The diagram makes it clear that the ceramics import weight did not go down. Scheduled supplies, buying stocks, urgent supplies and deliveries from China at high prices were quite stressful but stable. Sometimes, they were even ahead of schedule which gradually resulted in a surplus in the end manufacturers.
It should also be remembered that if 1000 microcontrollers $2 each are ordered, 10,000 capacitors for them $10 in total are conventionally purchased for six months.
The liabilities market in Russia is rather sluggish and if you have some problems related to liabilities, do not search for them in this month, check six months earlier. Even when saturation of stocks occurred, prices reached their climax and a waiting period began, deliveries were made directly for production. And this is where end manufacturers came out on top. Manufacturers were able to replace some high capacitance ceramics with polymer capacitors during the allocation period or just due to their technical specifications. Their import to Russia at least doubled.
Of course, the first manufacturer to give up was Yageo that unexpectedly dispatched goods in October, then abated the price and reduced the terms – its soap bubble burst. But generally, the market was quiet and that was the right time to act. Massive order cancellations (remember the panic and the outsized orders?) started in January 2019.
What did we get?
1. Was our decision to raise prices right? No, it wasn’t. We should have set the price at the market value minus 20%.
2. Was our estimate that the allocation was overarching right? No, it wasn’t. Ceramics was available. The Chinese dispatched it. Their prices were outrageous but they did. When consumers had to choose whether to buy capacitors at 5 cents in Russia or at 3 cents in China, they preferred the latter.
Of course, the analysis was not performed in real time but, as early as in November 2018, I was sure that ceramics allocation was coming to an end which was going to take place in the first quarter due to the market inertness.
If a company director or owner is reading the article, they will agree. They would never perform such a specific analysis with a rare exception of highly specialized companies. And they would not ask those questions to themselves. It is like asking a ship’s captain where the mop is.
The way of thinking described in the example above is not typical of a department head. It is a subtle matter associated with focusing on a narrow area. In this case, the manager needs only one talent: an ability to hear and engage the entire ship’s crew in problem solving.
Otherwise, even if the person swabbing the deck has some outstanding capabilities, he will not be able to make it clean. Imagine a captain telling the sailor that it is his duty to convince the accountant he really needs a mop.
But the analysis performed by your employee and your own lateral thinking could help to realize (if desired, of course) that some actions are wrong.
What else does the analysis offer in general? Let us try to find it out by considering an example.
Let us take the most highly-demanded customs code in one of product groups: 8 536 699 008 – plugs and sockets for voltages not exceeding 1000V.
So, 8 536 699 008. Since the analysis requires thoroughness when processing results as well as certain resources provided for the company, I consider only April 2018, from $500. We get the result shown in Tables 1–3. These are only three variants of numerous possible combinations.
Table 1. Analysis of import of goods under Table 2. Analysis of import of goods
code 8536699008 in April 2018 broken under code 8536699008 in April 2018
down by countries of dispatch broken down by manufacturers
Table 3. Analysis of import of goods under code 8536699008 in April 2018 broken down by receivers
Total:
Period: April 1, 2018 – April 30, 2018.
Statistic value: $18,077,258.
Total net weight: 886,711 kg.
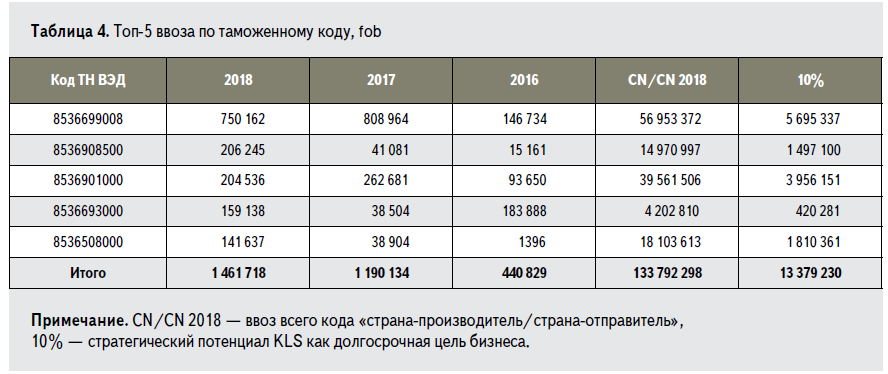
Although the database is publicly available, for ethical reasons, I mention only those who supply to themselves, agencies or enterprises. Then, let us imagine we are a distributor or a manufacturer and let us take, for example, KLS brand numbered 64. I will not describe the way the results were obtained, it is a matter of practice, but they are provided in Fig. 6–7 and in Table 4 where 2018/17/16 is import.
Fig. 6 Import by 44 customs codes,
fob. Sockets, connectors, switches,
inductors, antennas, resistors, etc Fig. 7 Top 3 distributors, fob import.
What can we see from the three results presented if you know nothing about the brand?
• The brand is growing and developing actively.
• Top 3 manufacturers do not provide for the growth. They are losing their share in KLS. The brand supplies a lot directly or via some new partners.
Table 4. Top 5 imports by customs code, fob.
The brand’s market share is 1% for the codes and it has a 5-fold growth potential among Chinese competitors. And what if KLS representatives offer you partnership? You are holding all the aces for the negotiations.
The analysis variations and applications differ in numerous areas:
• You can get some statistics about the proportion of goods accounted for by European and Chinese manufacturers.
• Which of the manufacturers import their goods directly and their amounts.
• Your market share.
• Market analysis by a particular manufacturer or code.
• What brands your end customer imports.
• What brands and codes a particular end goods receiver purchases.
• Checking the authenticity of the declaration number.
• Delivery terms (Incoterms)
• Choosing a partner.
Go for it! It is only crucial to admit your mistakes.


