Market of ceramic, tantalum and aluminum capacitors in Russia.
Good afternoon, dear readers, here is the second part of the review of the capacitor import market in Russia, where, as promised, we will analyze the capacitor market not as a whole, but by its component parts. But first of all, let’s briefly highlight the key aspects of the first part, which you can read on my site.
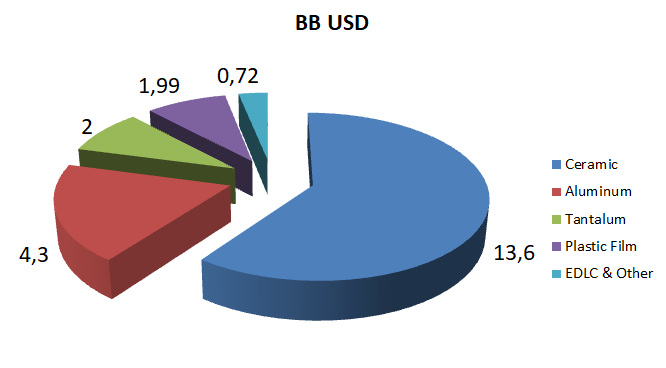
- According to the data from the analytical report of “Paumanok Publications, Inc” for 2018, the volume of passive component consumption in the world is determined by capacitors, which make up 53% of all passive components in unit terms.
Figure 1. Global sales of capacitors by group in 2018.
- China and Asian markets for capacitors are estimated at $ 14,115 million for fiscal 2018. The Japanese market for capacitors is estimated at $ 2,725 million. The European market for capacitors is estimated at $ 2,847. The capacitor markets in North and South America are estimated at $ 2,864 million.
- In 2019 all types of capacitors were officially passed through the customs of the Russian Federation, according to the customs code 8532*, in the amount of $ 99 million.
- Imports to Russia by brand are shown in Table 1.
Table 1. TOP imports by brand in 2019.
|
Manufacturer |
Total |
|
TDK(EPCOS) |
10127483 |
|
MURATA ELECTRONICS CO. LTD |
7338729 |
|
AVX CORPORATION |
7049687 |
|
YAGEO CORPORATION |
6301647 |
|
VISHAY |
5898488 |
|
SAMSUNG |
5556892 |
|
KEMET |
3412862 |
|
AMERICAN TECHNICAL CERAMICS |
2395105 |
|
PANASONIC |
2359468 |
|
ELECTRONICON KONDENSATOREN GMBH |
2158968 |
|
HITANO ENTERPRISE |
1406136 |
|
API TECHNOLOGIES |
1401488 |
|
UNITED CHEMI-CON |
1386337 |
|
TEAPO ELECTRONIC |
1089647 |
|
NICHICON |
1083871 |
|
EXXELIA S.A.S |
1013847 |
|
WALSIN |
933476 |
|
RTR ENERGIA S.L. |
795806 |
|
JIAWEICHENG ELCTRONIC |
789823 |
|
MAXWELL TECHNOLOGIES |
763863 |
|
FENGHUA |
742297 |
|
WURTH ELECTRONIC CO. LTD. |
732536 |
|
SAMWHA |
711704 |
|
JB CAPACITORS COMPANY |
707213 |
- The structure of the importers is shown in Table 2.
Table 2. The structure of the importers on the amount of import
|
Total Amount |
Importers |
Amount, million usd |
|
more than 1 million |
20 |
41 |
|
100 t – 1 mln |
122 |
36,5 |
|
10 t – 100 t |
306 |
10 |
|
1 t – 10 t |
406 |
1,65 |
You can read the full version of the article in the magazine or on the website commarketru.com about the Russian component market. Capacitor market in Russia. Part 1
Let’s return to our topic and look at the structure of imports to Russia in more detail in accordance with the customs codes in Table 3.
Table 3. Structure of imports of capacitors to Russia
|
CN FEA |
Total |
Description |
|
8532240000 |
31947236 |
Permanent multilayer ceramic capacitors |
|
8532220000 |
21435392 |
Permanent capacity aluminum electrolytic capacitors |
|
8532250000 |
12147424 |
Permanent capacitors with paper or plastic dielectric |
|
8532210000 |
11418395 |
Permanent capacity tantalum capacitors |
|
8532290000 |
4378863 |
Other permanent capacitors |
|
8532100000 |
4212990 |
Permanent capacitors for electrical circuits with a frequency of 50/60 Hz and designed for a reactive power of at least 0.5 kV (power capacitors) |
|
8532230000 |
3079554 |
Permanent single-layer ceramic capacitors |
|
8532300000 |
854473 |
Variable capacitors or tuning capacitors |
|
Total amount |
89474327 |
|
As mentioned above, all types of capacitors were officially imported, according to the customs code 8532*, for the amount of $ 99 million.
The author took the liberty of cleaning up this data a bit. In particular, he removed the brands “TOYOTA”, “SKODA”, with a description for the production of cars. “ABB AUTOMATION” service replacement, LLC “Samsung Electronics Rus Kaluga”, “LG ELECTRONICS” and LLC “LG Electronics Rus” – companies whose capacitors go to their own production. Shipments are made directly by the purchasing departments of the listed companies under international agreements. In total, all these deductions are significant and amount to $ 9 million. In my opinion, these deliveries are de facto Russian, but not de jure. In addition, the Russian market participants have no chance to supply these capacitors directly to these enterprises in Russia.
If we subtract the figures of the above companies, we still have $ 89,5 million.
Ceramic capacitors.
Permanent single-layer and multi-layer ceramic capacitors are imported under two codes 8532240000 and 8532230000. Total imports by brand are shown in Table 4.
Table 4. Imports of ceramic capacitors by brand in 2019.
|
Manufacturer |
Total |
|
MURATA ELECTRONICS CO. LTD |
7073347 |
|
SAMSUNG |
5504522 |
|
YAGEO CORPORATION |
5280919 |
|
AMERICAN TECHNICAL CERAMICS |
2390533 |
|
AVX CORPORATION |
2001408 |
|
TDK(EPCOS) |
1551488 |
|
API TECHNOLOGIES |
1278358 |
|
KEMET |
991702 |
|
WALSIN |
928682 |
|
VISHAY |
772477 |
|
HITANO ENTERPRISE |
735572 |
|
FENGHUA |
614787 |
|
WURTH ELECTRONIC CO. LTD. |
576278 |
|
FAITHFUL LINK INDUSTRIAL CORP |
445718 |
|
PROSPERITY DIELECTRICS CO. LTD |
412730 |
|
Total amount |
35026790 |
Surprisingly, the three leaders are the same, the pricing of “SAMSUNG” and “YAGEO” is about the same, but “MURATA” is seriously more expensive, so in pieces, sales of ceramic capacitors “MURATA” are not higher than those of “SAMSUNG” and “YAGEO”. The following Table 5 shows the structure of the importers depending on the import amount.
Table 5. The structure of the importers on the amount of import
|
Total Amount |
Importers |
Amount, million usd |
|
more than 1 million |
7 |
12 |
|
100 t – 1 mln |
57 |
16 |
|
10 t – 100 t |
151 |
5.5 |
As stated in one of the import reports, ceramic capacitors are the blood of any Board. Among the list of TOP 10 electronic distributors selling ceramic capacitors, you can immediately see those who are concerned with supplying the customer with a whole specification, who are working on a strategy of maximum customer satisfaction.
Table 6. The country of origin of ceramic capacitors
|
Country of origin |
Total |
|
China (CN) |
11158428 |
|
Japan (JP) |
6443083 |
|
Taiwan (China) (TW) |
5574825 |
|
USA (US) |
4168656 |
|
South Korea (KR) |
2667225 |
90% of all ceramic capacitors sold are produced in the above five countries (from Table 6), which is not surprising if you break down the component.
- “AMERICAN TECHNICAL CERAMICS” – almost all production is in the United States. The USA is one of the few countries that has retained production in ceramic capacitors, although the company itself “ATS” is a subsidiary of “AVX”, which, in turn, is a subsidiary of the Japanese giant “Kyocera”.
- The German divisions “TDK (EPCOS)” do not make ceramics in Germany, almost all of them are made in Japan and China, although most of the shipment comes from Europe.
It turns out that the Russian market of ceramic capacitors, at the location of the company’s Headquarters, is divided into three countries – Japan, Taiwan and Korea. But most of these companies’ production is localized in China.
Tantalum capacitor.
Tantalum capacitors are imported under the code 8532210000. Total imports by brand are shown in Table 7.
Table 7. Import of tantalum capacitors by brand in 2019.
|
Manufacturer |
Total |
|
AVX CORPORATION |
4015730 |
|
VISHAY |
3545440 |
|
KEMET |
1859373 |
|
SANYO JAYA COMPONENTS |
546366 |
|
PANASONIC |
303904 |
|
EXXELIA S.A.S |
170270 |
|
GUANGDONG HOTTECH |
91509 |
|
KYOCERA GROUP COMPANY |
87773 |
|
SAMWHA |
80952 |
|
ETOP INTERNATIONAL LIMITED |
74987 |
The top three hold almost 82% of the import market.
Table 8 shows the structure of importers depending on the import amount.
Table 8. The structure of the importers on the amount of import
|
Total Amount |
Importers |
Amount, million usd |
|
more than 1 million |
1 |
1,7 |
|
100 t – 1 mln |
31 |
6,5 |
|
10 t – 100 t |
83 |
2.6 |
Permanent capacity aluminum electrolytic capacitors.
Aluminum capacitors are imported under the code 8532220000. Total imports by brand are shown in Table 9.
Table 9. Imports of aluminum capacitors by brand in 2019.
|
Manufacturer |
Total |
|
TDK(EPCOS) |
3900834 |
|
PANASONIC |
1582115 |
|
UNITED CHEMI-CON |
1336750 |
|
TEAPO ELECTRONIC |
1079848 |
|
NICHICON |
1067475 |
|
YAGEO CORPORATION |
1016549 |
|
JIAWEICHENG ELCTRONIC |
789802 |
|
VISHAY |
762078 |
|
MAXWELL TECHNOLOGIES |
664782 |
|
HITANO ENTERPRISE |
646013 |
|
SAMWHA |
628440 |
|
HUNAN AIHUA GROUP CO.LTD |
543678 |
|
KENDEIL SRL |
462340 |
|
JB CAPACITORS COMPANY |
436975 |
|
HITACHI AIC INC. |
435806 |
Table 10 shows the structure of importers depending on the import amount.
Table 10. The structure of the importers on the amount of import
|
Total Amount |
Importers |
Amount, million usd |
|
more than 1 million |
4 |
5,3 |
|
100 t – 1 mln |
43 |
12,1 |
|
10 t – 100 t |
98 |
3.1 |
The power capacitors.
Power capacitors are imported under the code 8532100000. Total imports by brand are shown in Table 11.
Table 11. Imports of power capacitors by brand in 2019.
|
Manufacturer |
Total |
|
RTR ENERGIA S.L. |
795806 |
|
TDK(EPCOS) |
740111 |
|
ELECTRONICON KONDENSATOREN GMBH |
518621 |
|
ZEZ SILKO.S.R.O. |
413396 |
|
ALPES TECHNOLOGIES (GROUP LEGRAND) |
316378 |
|
CONDIS SA |
279820 |
|
AVX CORPORATION |
263529 |
|
INTERNATIONAL CAPACITORS SA |
132008 |
|
GRUPPO ENERGIA S.R.L |
124475 |
|
VISHAY |
103955 |
In fact, this table is not complete, since “HITACHI” brand from the Table 9 mostly consists of power capacitors. Duties are zero everywhere, apparently importers import as convenient. So, this table, as a complete cross-section of the market, cannot be represented.
Table 12 shows the structure of importers depending on the import amount.
Table 12. The structure of the importers on the amount of import
|
Total Amount |
Importers |
Amount, million usd |
|
more than 1 million |
0 |
0 |
|
100 t – 1 mln |
11 |
3,1 |
|
10 t – 100 t |
26 |
0.8 |
Capacitors of variable capacity or tuning.
Variable capacitors or tuning capacitors are imported under the code 8532300000. Total imports by brand are shown in Table 13
Table 13. Imports of variable capacity or tuning capacitors by brand in 2019.
|
Manufacturer |
Total |
|
API TECHNOLOGIES |
1274574 |
|
MURATA ELECTRONICS CO. LTD |
489695 |
|
VISHAY |
354264 |
|
SCHLUMBERGER |
238818 |
|
CLEVO CO. |
53175 |
|
TDK(EPCOS) |
44339 |
|
YAGEO CORPORATION |
43521 |
|
CONDUCTIVE CONTAINERS INC |
40193 |
|
JIANGSU SUMEC ELECTRONICS CO.LIMITED |
36312 |
|
SAMSUNG |
33404 |
Permanent capacitors with paper or plastic dielectric.
This group of capacitors is imported under the code 8532250000. Total imports by brand are shown in Table 14.
Table 14. Imports of capacitors with paper or plastic insulators by brand in 2019.
|
Manufacturer |
Total |
|
TDK(EPCOS) |
3699039 |
|
ELECTRONICON KONDENSATOREN |
1633544 |
|
VISHAY |
610011 |
|
AVX CORPORATION |
586119 |
|
WIMA |
346425 |
|
HENGYI ELECTRICAL CO. LTD |
322188 |
|
GRUPPO ENERGIA S.R.L |
280617 |
|
HUA JUNG COMPONENTS |
280117 |
|
JB CAPACITORS COMPANY |
250835 |
|
KEMET |
230542 |
Other capacitors of constant capacity.
This group of capacitors is imported under the code 8532290000. Total imports by brand are shown in Table 15.
Table 15. Import of capacitors that are not included in other codes by brand in 2019.
|
Manufacturer |
Total |
|
CUSTOM ELECTRONICS INC. |
263167 |
|
SUZHOU SHINY ELECTRONICS CO. LTD. |
262309 |
|
EXXELIA S.A.S |
254208 |
|
PANASONIC |
246515 |
|
TDK(EPCOS) |
229133 |
|
NINGBO HAILIDA ELECTRICAL EQUIPMENT CO. LTD. |
200301 |
|
AVX CORPORATION |
162838 |
|
MURATA ELECTRONICS CO. LTD |
137009 |
|
TUSONIX |
136384 |
|
LS MTRON |
131827 |
And in Russia.
From the annual reports of manufacturers and the Internet, I have compiled a list of capacitor manufacturers in 2018.
In the domestic market the main players are:
– JSC MESON FACTORY, Saint Petersburg;
– JSC “Elecond”;
– JSC “Novosibirsk plant of radio components “Oxide”;
– JSC “Research Institute Girikond”, Saint Petersburg;
– JSC “Voronezh condenser plant”;
– LTD “Plant ”Recond”, Saint Petersburg;
– LLC “Severo-Zadonskiy condenser factory”, Donskoi;
– LTD “Kuznetsk plant of capacitors”;
– Plant “Nyukon”;
– JSC “Kulon”;
– JSC ” Polycond»;
– PJSC “NZK”;
– LTD “SKZ “KVAR”;
– JSC “Elektrointer”.
The amount of their revenue is given in Table 16.
|
|
Revenue 2010 million Rubles |
Revenue 2010 million Usd |
Revenue 2018 million Rubles |
Revenue 2018 million Usd |
% |
Profit million Rubles |
Profitability |
|
JSC “Elecond” |
1032,0 |
34,0 |
3450,0 |
41,7 |
0,8 |
125,0 |
3,6 |
|
JSC MESON FACTORY |
214,0 |
7,0 |
590,0 |
7,5 |
0,8 |
119,0 |
20,2 |
|
JSC “Novosibirsk plant of radio components “Oxide |
210,0 |
6,9 |
432,0 |
6,2 |
0,9 |
18,0 |
4,2 |
|
JSC “Research Institute Girikond” |
304,0 |
10,0 |
1200,0 |
10,5 |
0,6 |
175,0 |
14,6 |
|
JSC “Voronezh condenser plant” |
н/д |
н/д |
143,0 |
1,1 |
0,5 |
0,0 |
0,0 |
|
LTD “Plant ”Recond” |
311,0 |
10,2 |
476,0 |
3,8 |
0,5 |
25,0 |
5,3 |
|
LLC “Severo-Zadonskiy condenser factory” |
н/д |
н/д |
76,0 |
1,1 |
0,9 |
0,0 |
0,0 |
|
LTD “Kuznetsk plant of capacitors”; |
н/д |
н/д |
153,0 |
1,9 |
0,8 |
7,0 |
4,6 |
|
Plant “Nyukon” |
н/д |
н/д |
84,0 |
1,3 |
1,0 |
9,7 |
11,5 |
|
JSC “Kulon” |
н/д |
н/д |
200,0 |
2,5 |
0,8 |
0,0 |
0,0 |
|
JSC ” Polycond» |
н/д |
н/д |
610,0 |
7,8 |
0,8 |
0,0 |
0,0 |
|
PJSC “NZK” |
н/д |
н/д |
71,0 |
0,2 |
0,2 |
2,0 |
2,8 |
|
LTD “SKZ “KVAR” |
н/д |
н/д |
554,0 |
7,0 |
0,8 |
5,6 |
1,0 |
|
JSC “Elektrointer” |
н/д |
н/д |
213,0 |
2,7 |
0,8 |
18,0 |
8,5 |
|
Total |
|
|
8252,0 |
95,4 |
|
|
|
Note.
Revenue in 2018 is taken from annual reports or presented based on the accounting statements for 2018. This is the full amount of revenue. Many businesses earn money by developing, renting out premises, and manufacturing various products that are not related to capacitors. If I could not find the percentage of revenue attributable to capacitors, then I took the indicator 0.8. If in the % column you see a value of 0.5 or 0.8, then in my opinion, 50% and 80% of revenue is accounted for the sale of capacitors. The “profitability” column shows the ratio of profit to revenue. If you add up the revenue of all the factories, you get $ 95 million.
According to the Federal state statistics service, the average price of electric capacitors was 406 rubles for 2018. Or at the average exchange rate of 62.9 rubles — this is 6.4 us dollars per piece. And the total number of electric capacitors produced in Russia is 26.9 million units.
After a simple calculation, we get a figure of $ 172 million. Dear colleagues, you have two figures in front of you – 95 million and 172 million, which of them is truer – you can choose. Perhaps, in Russia there are supergiants, which I through ignorance missed. Some manufacturers sell some of their products through their dealers, but I assume that Rosstat only takes into account producer prices, since it gives a specific figure in units in its statistics.
On the other hand, the figure of 26.9 million also raises questions, since in 2017, the annual report of JSC “Research Institute Girikond” stated the following:
“Nevertheless, recent years, it retains almost complete dominance of modern ceramic capacitors developed and manufactured by JSC “Research Institute Girikond.
Existing and planned production capacities in the coming years.
The current load is 60-65%.
|
Products |
Existing production, million units |
Potential production, million units |
|
Ceramic capacitors |
10 |
15 |
|
Tantalum capacitors |
0,73 |
1,2 |
|
Organic dielectric capacitors |
1 |
1.3-1.5 |
The report of the JSC “Kulon” noted only the production of ceramic capacitors – this is 17.5 million per year.
The report of JSC “Elecond” indicates the number of all capacitors for 2018 – more than 5.3 million units were sold.
Since ceramic capacitors are the blood of any board, I strongly doubt that the volume of production of ceramics in Russia as a whole has fallen. In total, these three plants already produce 35 million capacitors. Yes, of course, the difference between a ceramic chip capacitor and a power one, as between fire and water, but Rosstat also does not write that it only means aluminum capacitors. And the average price of capacitors indirectly indicates that Rosstat is referring to all types of capacitors.
On the other hand, despite the fact that factories produce ceramics and tantalum, we can safely say that there is no production market for ceramics and tantalum in Russia.
I can say that when I received the passive direction for development, I set a goal of 300 million pieces of ceramic capacitors, and besides me there are 100 competitors. And here one plant produces as many capacitors per year as one customer’s annual consumption.
I can confirm with confidence the general attitude of all our manufacturers.
“Unfortunately, Your questions touch on a certain area activities of the company that are a trade secret”.


