Part 1, the capacitor market in Russia
Have you ever thought about the structure of your clients’ specifications by product group, by money, by probability of your sale, by unsatisfied demand and unfulfilled sales?
Have you ever compiled a report similar to that in Table 1?
The report contains average, approximate figures offered for example. Depending on the business model, your market conditions, differences in clients, brands’ lines, the company’s strong and weak points, they will always be different. But the point will be the same.
Table 1. Approximate structure – availability in specification.
|
Product type |
% lines in BOM |
% from the BOM amount |
% of sales from all requests |
Availability in BOM |
|
Resistors |
25 |
2 |
25 |
100 |
|
Linear integrated circuits |
4 |
20 |
13 |
23 |
|
Microcontroller |
2 |
15 |
10 |
15 |
|
Capacitor |
20 |
20 |
5 |
100 |
|
Connectors |
7 |
3 |
50 |
50 |
|
Logic integrated circuit |
2 |
1 |
60 |
68 |
|
Throttle |
4 |
2 |
45 |
|
|
Frequency resonant cavity |
1 |
2 |
90 |
56 |
|
Diode |
5 |
1 |
80 |
100 |
|
Protection |
1 |
0,5 |
10 |
24 |
|
Filters |
1 |
1 |
10 |
20 |
|
other |
28 |
32,5 |
43 |
56 |
In Russia, there are only about a dozen suppliers of electronic components, whose lines contain almost all families of electronic components; the rest specialize in particular items. There are specialized project distributors, there are passive ones, there are monobrand ones, and there is even a supplier listed in the TOP 15 that has not a single distribution agreement. Some don’t want to deal with programmable logic, others – with analogous, and some – with passive components. At the same time, the passive is the most important component for delivering a complete specification to the client. And which passive component is the most popular in terms of money and lines in your clients’ specification? If you have compiled Table 1, you would probably have given the right answer – capacitors. Further in this article, we will analyze the capacitor market in Russia. If you have compiled a similar Table 1, you would have seen three factors that are important to us.
- There are always capacitors on a client’s board.
- Capacitors can account for up to 20% of the cost of all the board components. By not dealing with capacitors, you give up 20% of the market of your own free will.
- You won’t be able to fully satisfy your clients if you don’t supply capacitors.
This article is the first of a series of articles about the passive components market in Russia – an extremely important market.
The global sales of capacitors.
According to data presented in the report by Paumanok Publications, Inc for 2018, the volume of the global passive component consumption is determined by capacitors, which account for up to 53% of all passive components, in unit terms. The largest share in the total volume (units) belongs to MLCC (multilayer ceramic capacitor). Resistors are the second, which account for up to 44% of the volume of passive components consumption. We are sure to talk about resistors in the further articles. Subscribe to facebook and linkedin pages so that you wouldn’t miss any of the important information.
According to the report by Paumanok Publications, Inc for 2018, in the fiscal year reported on, the global sales of capacitors fell into categories as shown in Picture 1. The total sales in 2018 amounted to $22.6 billion.
Picture 1. The global sales of capacitors by groups in 2018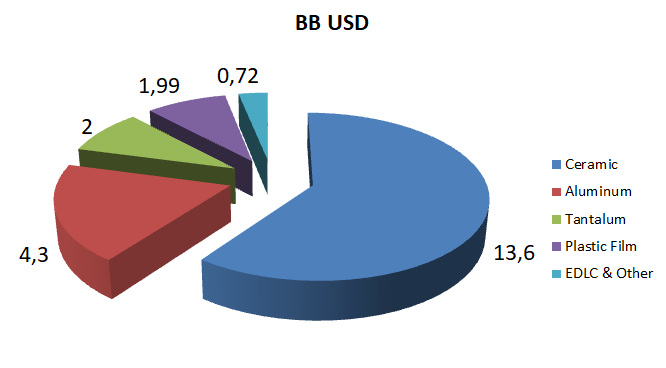
For several decades already, the global consumption of passive components has been shifting towards China and Southeast Asia at the expense of other regions. First of all, this is due to transfer of electronic industry manufacturers to China and Asia, as well as development of OEM production, with Taiwanese Foxconn being the most famous of them.
By 2023, China and Asia are expected to account for 63% of consumption, Europe – for 13%, America – for 13%, and Japan – for 11%. Between FY 2007 and FY 2018, the volume of capacitor consumption in China and Southeast Asia increased by 27%. China and Asian capacitor markets are estimated at $14,115 million in fiscal 2018. The Japanese capacitor market is estimated at $2,725 million. The European market of capacitors is estimated at $2,847. The capacitor markets in North and South America are estimated at $ 2,864 million. The distribution of sales by global brands is shown in Table 2.
Table 2. TOP-13 of capacitor suppliers. Sales revenue for capacitors and market shares in 2018, millions of USD
|
|
2015 |
2018 |
% of Total |
|
Murata |
2,918 |
4,018 |
17.8% |
|
Samsung |
1,727 |
2,308 |
10.2% |
|
Kyocera / AVX Caps |
1,221 |
1,559 |
6.9% |
|
Taiyo Yuden |
999 |
1,363 |
6.0% |
|
TDK(EPCOS) |
1,332 |
1,345 |
6.0% |
|
Nippon Chemi-Con |
976 |
1,130 |
5.0% |
|
KEMET |
834 |
1,125 |
5.0% |
|
NICHICON |
835 |
1,072 |
4.8% |
|
Rubycon |
550 |
860 |
3.8% |
|
Panasonic/Sanyo |
763 |
750 |
3.3% |
|
YAGEO |
435 |
565 |
2.5% |
|
Vishay |
420 |
403 |
1.8% |
|
Walsin |
226 |
350 |
1.6% |
The Russian share in the global sales.
In 2019, the customs of the Russian Federation officially processed all types of capacitors under the customs code 8532* in the amount of $99 million.
The author took the liberty of cleaning this data up a bit. For example, I deleted TOYOTA and SKODA brands with description for auto production. ABB AUTOMATION for service replacement, OOO Samsung electronics Rus Kaluga, LG ELECTRONICS and OOO LG electronics Rus – the companies whose capacitors are delivered for their own production. Shipments are performed directly by purchasing departments of these companies under international agreements. In total, these deductions are significant and amount to 9 million USD. To my mind, these deliveries are actually Russian, but not from the legal point of view. Moreover, the Russian market participants have no chance to supply these capacitors directly to these enterprises in Russia.
If we deduct the figures of the above-mentioned companies, we still have 89.5 million USD left. According to data from the global semiconductor market research by Gartner, the 2019 decline resulted in 11.6% from the level of 2018.
According to Paumanok Publications, which specializes in reports on the capacitor market, the global sales of capacitors in 2019 amounted to 19 billion USD, or 15.9 % of the level of 2018.
Unfortunately, foreign global analytical reports cost from 4000 USD and more. Acting as an individual, I face certain difficulties in buying them. I should apologize to the readers, but I decided to use a coefficient of 0.85 from the level of 2018 to get the sales by brand and type in 2019.
Thus, the Russian sales amounted to 89.5 million USD (the total import amount is 99), with global sales amounting to 19 billion USD. Accordingly, the Russian import market accounts for 0.46% of the global sales. Indeed, even 99 million of the total import amounts won’t change the situation. This is 2 times lower than the generally accepted figure of 1%-share of the global sales accepted on the Russian market.
An attentive reader has definitely noticed that I fibbed a little. The Paumanok Publications report includes only certain types of capacitors. Import under the 8532 code is a bit wider in terms of nomenclature, so the real amount of 89 million and 0.46% will be even smaller. There are two possible options here: either the prices that our importers have are unprecedently lower than the global ones, or the generally accepted figure of 1% is much lower in fact. I am sure that in the second part of the article, when we will analyze particular groups of ceramic, aluminum, tantalum and film capacitors, we will solve this issue. Subscribe on your website or social networks so that you don’t miss the second part.
But let’s return to our import. The import by brand is shown in Table 3. The table unites only such brands as TDK and EPCOS, but the company ATC (American Technical Ceramics Corp.) – a manufacturer of highly reliable capacitors, resistors, inductors, is a subsidiary of AVX, which, in turn, is a subsidiary of the Japanese giant Kyocera, and is presented separately.
Table 3. TOP imports by brands in 2019.
|
Manufacturer |
Total |
|
TDK(EPCOS) |
10,127,483 |
|
MURATA ELECTRONICS CO. LTD |
7,338,729 |
|
AVX CORPORATION |
7,049,687 |
|
YAGEO CORPORATION |
6,301,647 |
|
VISHAY |
5,898,488 |
|
SAMSUNG |
5,556,892 |
|
KEMET |
3,412,862 |
|
AMERICAN TECHNICAL CERAMICS |
2,395,105 |
|
PANASONIC |
2,359,468 |
|
ELECTRONICON KONDENSATOREN GMBH |
2,158,968 |
|
HITANO ENTERPRISE |
1,406,136 |
|
API TECHNOLOGIES |
1,401,488 |
|
UNITED CHEMI-CON |
1,386,337 |
|
TEAPO ELECTRONIC |
1,089,647 |
|
NICHICON |
1,083,871 |
|
EXXELIA S.A.S |
1,013,847 |
|
WALSIN |
933,476 |
|
RTR ENERGIA S.L. |
795,806 |
|
JIAWEICHENG ELCTRONIC |
789,823 |
|
MAXWELL TECHNOLOGIES |
763,863 |
|
FENGHUA |
742,297 |
|
WURTH ELECTRONIC CO. LTD. |
732,536 |
|
SAMWHA |
711,704 |
|
JB CAPACITORS COMPANY |
707,213 |
In total, more than 100 different manufacturers supply capacitors to Russia, half of which have no distributors or representative offices. But almost all manufacturers in Table 3 cooperate with distributors. This is another proof that for manufacturers who want to increase their market share in Russia distributors are a must, with whom they should be able to contact, control, direct and help.
If we look at the top 20 importers (Table 4), we will see that 14 of them are intermediaries.
Table 4. Top-20 importers of capacitors, USD in 2019.
|
|
Total |
Type |
|
1 |
7,000,408 |
Intermediary |
|
2 |
5,985,208 |
Intermediary |
|
3 |
2,802,885 |
Manufacturer |
|
4 |
2,176,283 |
Intermediary |
|
5 |
2,145,219 |
Intermediary |
|
6 |
1,980,241 |
Manufacturer |
|
7 |
1,877,454 |
Intermediary |
|
8 |
1,739,218 |
Intermediary |
|
9 |
1,700,304 |
Intermediary |
|
10 |
1,511,672 |
Manufacturer |
|
11 |
1,386,640 |
Intermediary |
|
12 |
1,367,767 |
Customs broker |
|
13 |
1,299,679 |
Intermediary |
|
14 |
1,274,076 |
Manufacturer |
|
15 |
1,208,511 |
Intermediary |
|
16 |
1,174,881 |
Intermediary |
|
17 |
1,134,620 |
Manufacturer |
|
18 |
1,127,792 |
Intermediary |
|
19 |
1,083,485 |
Intermediary |
|
20 |
1,082,933 |
Manufacturer |
Don’t be misled by the term “intermediary”. In this respect, Russia is a unique country: depending on the brand or product, intermediaries account for 50-90% of sales. In this context, this term has no negative connotation; it only meets the criteria that describe the whole palette – from a distributor and broker, to personal relations, as well as one-day companies. Again, if you want to increase your market share in Russia, you can’t do without distributors or your own representative office. And this rule applies not only to foreign manufacturers, but to Russian ones as well. In almost all the articles, I emphasize that it is a grave mistake for Russian manufacturers to have no civilian distributors. There is no doubt that some of the major Russian manufacturers have distributors, but when we look at them, it becomes clear that almost all of them specialize in the closed market and work according to different rules.
The structure of importers can be found in Table 5.
Table 5. The structure of importers by import amount
|
Total |
Importers |
Amount, million USD |
|
More than 1 million |
20 |
41 |
|
100 thousand-1 million |
122 |
36.5 |
|
10-100 thousands |
306 |
10 |
|
1-10 thousands |
406 |
1.65 |
The following two tables show, where the product has been sold – Table 6 and the first two brands in this country
Table 6. The trading country.
|
Germany (DE) |
26,322,518 |
|
Hong Kong (HK) |
12,920,228 |
|
China (CN) |
8,466,832 |
|
USA (US) |
7,043,944 |
|
Great Britain (GB) |
5,039,872 |
|
Taiwan (China) (TW) |
4,109,528 |
|
Belgium (BE) |
4,096,989 |
|
Singapore (SG) |
2,660,633 |
|
The Check republic (CZ) |
1,519,412 |
|
Switzerland (CH) |
1,375,992 |
|
Slovakia (SK) |
1,286,885 |
Table 7. The trading country and the top 2 brands in it.
|
Trading country |
Manufacturer |
Total |
|
Germany (DE) |
TDK(EPCOS) |
7,701,423 |
|
|
SAMSUNG |
2,714,837 |
|
Hong Kong (HK) |
YAGEO CORPORATION |
1,708,016 |
|
|
MURATA ELECTRONICS CO. LTD |
1,405,467 |
|
Great Britain (GB) |
AMERICAN TECHNICAL CERAMICS |
1,700,803 |
|
|
SANYO JAYA COMPONENTS INDONESIA |
546,366 |
|
USA (US) |
API TECHNOLOGIES |
1,386,893 |
|
|
KEMET |
851,378 |
|
Taiwan (China) (TW) |
HITANO ENTERPRISE |
1,375,447 |
|
|
YAGEO CORPORATION |
458,971 |
|
Belgium (BE) |
MURATA ELECTRONICS CO. LTD |
853,396 |
|
|
AVX CORPORATION |
781,486 |
|
France (FR) |
EXXELIA S.A.S |
777,370 |
|
|
ALPES TECHNOLOGIES (GROUP LEGRAND) |
316,378 |
|
China (CN) |
FENGHUA |
566,541 |
|
|
YAGEO CORPORATION |
477,664 |
And what about production of capacitors in Russia.
I’ll put it like that – if compared to microchips – great. That’s all I can say. Type “production of capacitors in Russia” in the search bar and you will get no results at all. No general figures, no estimated data, as if it were a military secret. None of the journalists write about it. There are hundreds of articles and news about microprocessors, and only few about capacitors. In Russia, there are such capacitor-manufacturing plants as Severo-Zadonsky plant, OOO Kuznetsky Zavod Kondensatorov, Nyukon plant, OAO Kulon, OAO Zavod MEZON, OAO NZR Oxid, OAO Polykond, OAO Zavod Recond, OAO Elecond. Actually, this is all the information that you can collected about the market of Russian manufacturers of capacitors. The Russian production is mainly focused on electrolytic, power capacitors, and capacitor units.
The basis of any electronics – ceramic capacitors account for no significant share in the structure of Russian production. Ruselectronics Holding from the State Corporation Rostech in 2016 wrote: “we have mastered production of ceramic capacitors that can replace up to 40% of similar imported products used in Russian military radio-electronic equipment.” The keyword is “military” – it was not even intended to be used in the civilian sector.
Therefore, it is only possible to approximately estimate the volume to compare with. I can’t take responsibility for those figures, but I will write how I’ve calculated them.
Unfortunately, the Federal State Statistics Service has sent an extremely strange response to my letters. Literally speaking, all the information is on the website. But it is extremely difficult to find anything there. According to the Federal State Statistics Service, the average price of electric capacitors in 2019 was 413 rubles. Or at the average exchange rate of 64.61 rubles – this amounted to 6.4 USD per unit. And the total number of electric capacitors produced is 26.9 million units.
The global supply of capacitors in 2018 amounted to approximately 2.026 trillion units, and to approximately 1.76 trillion units (the level of 2018 multiplied by 0.85) in 2019, with the sales of 19 billion USD. Consequently, in 2019, the average capacitor price was 0.011 cents.
But you shouldn’t be surprised by such an astronomical difference; you should just consider the following points.
- The Federal State Statistics Service on its website doesn’t divide capacitors by type; for them all capacitors are united by the single type – electric capacitors. Perhaps, this is not the case, but I didn’t manage to get any clarification from them. For the Statistics Service, a ceramic capacitor and capacitors for electric motive power are something similar. In general, that’s not the problem if production of ceramic capacitors in cases 0402, 0603, etc. would be at the global level, i.e. 44% of the total number of capacitors.
- What we have in fact. I will only say that one of the intermediaries from the TOP 5 of Table 4 sold more than 200 million units of ceramic capacitors in Russia in 2018 only.
Just imagine: in Russia, all the plants together produced 22.6 million units, including ceramics by Rostech, but one single intermediary sold more than 200 million units. Only one of more than 300 importers. And this is only capacitors.
Have you read the Russian electronic industry development strategy? The word “capacitor” hasn’t been mentioned there at all! It seems to me that our strategy follows Stalin’s five-year plans for developing heavy industry.
Where do Russian-made capacitors are supplied: the military and space sectors, secondary power sources, frequency converters, installations for melting and heat treatment of metals, excess-voltage protection units for electric motors, storage and filter segments of interchange chains, semiconductor devices, shipbuilding, railway transport, and radio equipment.
As you can understand, we produce almost no capacitors for household appliances or for ordinary civil boards, – that’s why their price is 6.4 dollars.
Nevertheless, although the figures raise more questions than give answers, we have them, so let’s multiply 22.6 million units by 6.4 dollars – we will get the domestic market of electric capacitors that amount to 144.6 million USD. In total, the import and the domestic market amount to 243 million USD. I don’t believe that figure. Let’s hope that one of the responsible employees of the Statistics Service or the Department of radio-electronic industry will read the first part and contact me, and then I will be able to give a more complete answer about the domestic capacitors production in Russia in the second part. I agree to co-authorship, but meanwhile, we have such a separation of capacitors production in Russia.
Additionally, I can add that in 2019, Russia exported capacitors under the code 8532 for 3 million USD.
In conclusion, let’s compare the sales volumes in Table 1 with the sales in Russia – Table 8.
Table 8. Sales in 2018 and 2019, percentage.
|
|
2018, global |
2019, in Russia |
% |
|
Murata |
4,018 |
7.3 |
0.18 |
|
Samsung |
2,308 |
5.5 |
0.23 |
|
Kyocera / AVX/ATC |
1,559 |
9.4 |
0.60 |
|
Taiyo Yuden |
1,363 |
|
0 |
|
TDK(EPCOS) |
1,345 |
10.1 |
0.75 |
|
Nippon Chemi-Con |
1,130 |
1.38 |
0.12 |
|
KEMET |
1,125 |
3.4 |
0.30 |
|
NICHICON |
1,072 |
1.08 |
0.10 |
|
Rubycon |
860 |
|
0 |
|
Panasonic/Sanyo |
750 |
2.3 |
0.30 |
|
YAGEO |
565 |
7.4 |
1.30 |
|
Vishay |
403 |
5.9 |
1.46 |
|
Walsin |
350 |
0.9 |
0.25 |
I can assume that only the Board of Directors of Vishay and YAGEO companies can see Russia on their sales charts. Sales of such giants as Rubicon and Taiyo Yuden haven’t even make it to the TOP shown in Table 3
I should make it clear that the sales by brands have been combined according to known data.
- Nippon Chemi-Con has two subsidiaries: United Chemi-Con (in the USA) and Europe Chemi-Con (in Germany).
- In 1997, Yageo acquired another Taiwanese company, Chilisin, and holds the controlling stake in Teapo Electronic.
- I have not taken into account the news that Yageo is acquiring KEMET Corporation, since the deal is still in progress. If everything runs smoothly, the united company of Yageo- KEMET- TEAPO – Chilisin brands will become the largest importer of capacitors in Russia.
This is extremely gratifying to the author, as he has been developing Yageo sales in Russia for five years. During this time, the distributing company has tripled its sales and reached the highest rank in sales of ceramic capacitors. The figure 1.3% has a part of the author’s merit.
Perhaps, we can conclude the article with this pleasant information. Subscribe on the website or on the social media if you want to read the whole series of articles about passive components and not to miss the second part, where capacitors will be analyzed by certain groups.
Colleagues, it is important – if you have noticed an error, inaccuracy or have updated information – be sure to write it, and the second part of the article about capacitors will be even more accurate.
If you liked the article, please don’t forget to leave a like or share it. Thanks.