The market of Texas Instruments in Russia. TOP of suppliers, consumers, distributors.
23.01.2020 the article “Texas Instruments in Russia. Revolution or opportunities” was published on my website, where I described possible action plans for brokers and conducted a market analysis for the first six months of 2019.
If you are interested, please follow the link: “Texas Instruments in Russia. Revolution or opportunities”. The article was one of my very first experiences of this kind. Since then, I have greatly improved the processing and presentation of the material. My last article is devoted to the main competitor of TI – a company Analog Devices. You can read it here: “AnalogDevices in Russia. Suppliers and consumers”
Special opinion
So, what do we have? The main event in 2020 was the opening of TI market for brokers, literally to all its participants – Radiotechtrade, Elitan, Promelectronics and even to a modest player – N. At the same time, TI produces almost the entire line of active components and is very well known on the market. As an IDM (Integrated Device Manufacturer), TI develops and manufactures its own chips at enterprises instead of transferring production to third parties. This is very relevant now, as IDM protects Texas Instruments from a global shortage of semiconductors.
Another important feature of TI is its strong dependence on dividends and stock growth. The company has been paying dividends to investors every year since 1962 and has increased the amount of payments for 14 consecutive years, regardless of the annual results. And all these are not a a flash in the pan, but a process supported by a real increase in the production. Also, every year this fact puts pressure on the shareholders, and through them, on the board of directors. And the company has a lot of shareholders. According to information at the beginning of 2021.
VanguardGroup, Inc. is currently the largest shareholder of the company with 9.0% of the shares. BlackRock, Inc. is the second largest shareholder, owning 7.7% of ordinary shares, and StateStreetGlobalAdvisors, Inc. owns approximately 4.2% of the company’s shares.
Institutional investors (insurance companies, pension funds, investment companies, mutual and charity funds) own more than 50% of the company, and together they can have a strong influence on the decisions of the board of directors. The largest 25 shareholders collectively own less than 50% of share registry, which means that no individual has a majority interest.
But despite the absence of key owners, TI management system is strikingly effective. According to the results of 2020, Texas Instruments registered a net profit of $ 5.6 billion. In 2019, such a profit amounted to about $ 5.02 billion. And there is more to come. Currently it is expected that during the forecast period (2021-2026), the analog integrated circuits (IC) market will have an average annual growth rate of 5.5%.
What will contribute to this growth?
First of all, the continued distribution of smartphones, functional phones and tablets, base radio stations of the third and fourth generation, RFIC. In addition, in the future, it is possible to increase the sale of specialized analog ICS for autonomous vehicles, since new functions will appear in cars and the range of existing ones will expand.
The sales of TI, the company which occupies the first place in the world in terms of analog chips, have all the prospects for further organic growth. In order to contribute to it, the company chooses its own innovative development path, which consists in rejecting all distributors, except Arrow and several other regional or catalogue partners. I believe that it is wrong to do so in countries with a specific market, but given the volume of sales in Russia in relation to the entire market (see Table 1), this is not important. As can be seen from the table, the share of Russia in sales does not exceed 0.4%. It is important to clarify that the real figure of sales to Russia according to the reports for the board of directors will be even lower, since it takes into account only sales data provided by distributors and sales departments of TI itself. My figure of 0.4 % also takes into account unofficial channels, so it will be higher than official data. Of course, with this ratio, board of directors in TI hardly sees Russia on its charts at all. And no one certainly takes into account the interests and invested work of Russian distributors.
Table 1. Sales volumes of TI
| $, bln | Growth | |
| Import to Russia | 0.062 | |
| Revenue in the world | 14.46 | |
| Analog chips | 10.87 | 6% |
| Microchips for embedded systems | 2.57 | -13% |
| Other products | 1.02 | -17% |
It will be interesting to compare these data with a competitor, see table 2.
Table 2. Comparison of TI and AD by market share in Russia
| AD | AD+ MaximIntegrated | TI | |
| Share of sales in Russia, % | 1.2 | – | 0,4 |
| Revenue in Russia, mln USD | 72.4 | 80.9 | 62 |
You can learn more about sales of AD from table 1 of the article: “AnalogDevices in Russia. Suppliers and consumers”.
The competitive struggle between two world giants continues. Russia is the calmest front for both giants, due to its insignificance. So far, TI is winning in the world. The company maintains its position in the analog IC sector, which accounts for 19% of global sales. But it seems to me that the strategy of AD in Russia is more profitable in the long run. TI also does not have such a separation from AD here.
Texas Instruments in Russia.
It is easier to write this analysis, since there are no regional distributors in Russia. I equate all former distributors with suppliers, although, of course, this does not negate their obvious advantages. TI has not bought anyone for a long time, so all import data is clean, because National Semiconductor, absorbed in 2011, is fully integrated into TI imports and imported under this brand on an extremely small scale.
Part 1. Consignees
More than 200 importers have imported the brand TI to Russia in the amount of $ 10,000, so I will divide the importers into 2 groups. Table 3 will show only TOP 100 suppliers I calculated, and table 4 will show only manufacturers. In both cases, only suppliers and manufacturers with websites (if there are any) that I have uniquely calculated are considered. Contract manufacturers and transport companies are not included in the tables. When you buy an article, you will receive data for each of them. Those who are not included in the tables will be given without websites.
Table 3. TOP-100 Importers-suppliers of Texas Instruments in Russia in 2020.
| Name of the consignee | Consignee TIN | Final result | Site |
| 1 | 9312568 | ||
| 2 | 3918471 | ||
| 3 | 2366820 | ||
| 4 | 1292029 | ||
| 5 | 1269105 | ||
| 6 | 952379 | ||
| 7 | 867814 | ||
| 8 | 764787 | ||
| 9 | 680147 | ||
| 10 | 537746 | ||
| 482521 | |||
| 416042 | |||
| 317248 | |||
| 278481 | |||
| 264996 | |||
| 249904 | |||
| 238347 | |||
| 189942 | |||
| 177718 | |||
| 177497 | |||
| 166329 | |||
| 165620 | |||
| 164202 | |||
| 163171 | |||
| 149816 | |||
| 141820 | |||
| 140817 | |||
| 135182 | |||
| 127141 | |||
| 122480 | |||
| 119823 | |||
| 118731 | |||
| 117562 | |||
| 112744 | |||
| 102708 | |||
| 94676 | |||
| 92783 | |||
| 92594 | |||
| 86946 | |||
| 86834 | |||
| 85437 | |||
| 83763 | |||
| 83121 | |||
| 80951 | |||
| 79388 | |||
| 76876 | |||
| 76508 | |||
| 75930 | |||
| 74263 | |||
| 69024 | |||
| 67618 | |||
| 64995 | |||
| 63413 | |||
| 63212 | |||
| 60485 | |||
| 59870 | |||
| 58309 | |||
| 58101 | |||
| 56428 | |||
| 54780 | |||
| 54313 | |||
| 51406 | |||
| 49175 | |||
| 48200 | |||
| 47127 | |||
| 46458 | |||
| 43453 | |||
| 42510 | |||
| 42277 | |||
| 40141 | |||
| 37310 | |||
| 37119 | |||
| 36669 | |||
| 36425 | |||
| 35153 | |||
| 34852 | |||
| 34746 | |||
| 32976 | |||
| 32546 | |||
| 25631 | |||
| 24704 | |||
| 24030 | |||
| 23813 | |||
| 23230 | |||
| 22971 | |||
| 21533 | |||
| 20948 | |||
| 20209 | |||
| 18920 | |||
| 18491 | |||
| 18205 | |||
| 17363 | |||
| 16307 | |||
| 14194 | |||
| 13326 | |||
| 12901 | |||
| 12787 | |||
| 12347 | |||
| 11405 | |||
| Final result | 29805184 |
The figure of 29.8 million includes only those importers whom I could clearly identify as intermediaries or distributors.
We can safely say that for the supplier market, 29 mln is a market of pure competition, where each player can replace another.
Table 4. Importers-producers in 2020.
| Name of the consignee | Consignee TIN | Final result | Site |
| 1 | 5262362 | ||
| 2 | 4538231 | ||
| 3 | 2029856 | ||
| 4 | 1910396 | ||
| 5 | 1476063 | ||
| 6 | 1261696 | ||
| 7 | 865240 | ||
| 8 | 643154 | ||
| 9 | 501735 | ||
| 10 | 385883 | ||
| 381669 | |||
| 377659 | |||
| 369556 | |||
| 345147 | |||
| 304319 | |||
| 282590 | |||
| 281286 | |||
| 240656 | |||
| 209741 | |||
| 171671 | |||
| 170899 | |||
| 170031 | |||
| 162363 | |||
| 154432 | |||
| 150221 | |||
| 136315 | |||
| 112690 | |||
| 111664 | |||
| 110012 | |||
| 96990 | |||
| 91886 | |||
| 87431 | |||
| 80445 | |||
| 79040 | |||
| 78012 | |||
| 65912 | |||
| 58455 | |||
| 58345 | |||
| 57863 | |||
| 52885 | |||
| 46505 | |||
| 46385 | |||
| 44829 | |||
| 39428 | |||
| 39221 | |||
| 36521 | |||
| 34020 | |||
| 33971 | |||
| 30208 | |||
| 29744 | |||
| 16674 | |||
| 14493 | |||
| 13270 | |||
| 10849 | |||
| Final result | 24360919 |
The summarized data are presented in table 5.
Table 5. Summary data on Texas Instruments importers in Russia.
| Type | Final result | % |
| TOP-100 Suppliers | 29805184 | 48 |
| All the others: suppliers and manufacturers up to 10,000, Questionable, IT Distributors, Customs brokers. | 6658246 | 11 |
| Manufacturers, including contract manufacturing | 25307497 | 41 |
| Final result | 61770927 | 100 |
If you have read my article about AD, you probably have noticed that the sales structure is very different from AD. The text clearly shows that only 13% of all imports by AD are accounted for by the manufacturers’ own foreign trade departments. Direct import via TI, omitting Russian intermediaries in Russia, is several times higher. If you buy an article, you will be able to see for yourself according to the data, how much is accounted for by Russian distributors, global senders and companies like yours.
In general, the sales structure of TI goes towards the goal of direct purchases. We will find out how much this corresponds to reality in the next part.
Part 2. Suppliers.
Sooner or later, after reading my 1st article and coming to the appropriate conclusions, you will have a list of items consumed by the client that your company does not supply. The question will arise: “Where to buy?”. My next table will help you with its solution. Table 6 shows TI suppliers from whom the importers listed in tables 5 and 6 bought.
Table 6. Importers-suppliers
| Name of the supplier | Final result | Website |
| ARROW | 11660349 | arrow.com |
| 2 | 5750526 | |
| 3 | 3253921 | |
| 4 | 1556972 | |
| 5 | 862194 | |
| 6 | 853567 | |
| 7 | 532762 | |
| 8 | 336203 | |
| 9 | 243607 | |
| 10 | 241622 | |
| 11 | 233264 | |
| 205285 | ||
| 193460 | ||
| 171169 | ||
| 142677 | ||
| 141121 | ||
| 95776 | ||
| 83780 | ||
| 77461 | ||
| 75878 | ||
| 69744 | ||
| 64445 | ||
| 58600 | ||
| 56418 | ||
| 46442 | ||
| 46363 | ||
| 39920 | ||
| 39634 | ||
| 39419 | ||
| 36682 | ||
| 35596 | ||
| 35232 | ||
| 33372 | ||
| 30261 | ||
| 28176 | ||
| 26525 | ||
| 21320 | ||
| 20027 | ||
| 16928 | ||
| 16307 | ||
| 14804 | ||
| 11608 |
I added only those suppliers who I was able to identify or find their website. It is assumed that some of them may be companies owned by the Russian suppliers. Nevertheless, I removed the identified consolidating companies from the list.
Thanks to the table with the suppliers, it is clear that the final motivation of the manufacturer TI, i.e. to remove intermediaries from the sales structure, is far from the goal. In Russia, the company supplies microscopically little directly to the final manufacturers. Global distributors still supply about $ 20 million directly to Russia. Former distributors imported at least 13 million rubles to Russia. This amount includes all their purchases. I don’t even know how to call the balance, which accounts for the remaining 28 million, because officially TI now does not have any gray market. The key difference between TI and AD in Russia is that now it does not have promotion channels in Russia through distribution.
Go to the website rlocman.ru
TI – 9 news from the beginning of the year. All translations were made due to the initiative of the website itself.
AD – 28 news from the beginning of the year. Some of them came from a former distributor of TI. The news were published as part of an advertising collaboration.
A year ago, the ratio was different. And I have not touched TI Banners yet, which simply disappeared from rlocman website and from the Internet, as previously happened with the references to seminars.
Russian distributors, excluding Compel, account for less than half of AD imports to Russia. The situation is even worse now.
Let’s see what happens next…If the situation does not change, TI will lose market share in Russia, which, of course, will not affect the global situation in any way. At this point, see Table 7. The company’s imports to Russia are stable, but in general, according to quotas from suppliers, starting from 2019, it is clearly visible that there is an increase in prices in Russia. There is a stalemate situation. TI, as planned, takes the margin of the former distributors for itself, there is an increase in the profitability of the company, the shareholders are satisfied. But the sales structure has remained the same, the intermediaries themselves have not disappeared anywhere.
There is another problem that consumers themselves have shared with me. More precisely, there are even two of them. The first is the lack of an opportunity to place an order on request and the store’s work on TI website is only based on availability. The second difficulty is probably related to the internal problems of TI. Its essence is that by placing 10 items for purchase, you will receive 10 individual shipments. This makes the cost of delivery and customs clearance extremely expensive for Russia.
Table 7 Import of TI brand in Russia by years.
| Year | Cost
$ |
| 2020 | 62 |
| 2019 | 59 |
| 2018 | 65 |
| 2017 | 56 |
But, as I said above, our situation is not worth analyzing for the entire TI business. We are also not interested in how the pedestal is distributed in the world. We are interested in the availability and price directly in Russia.
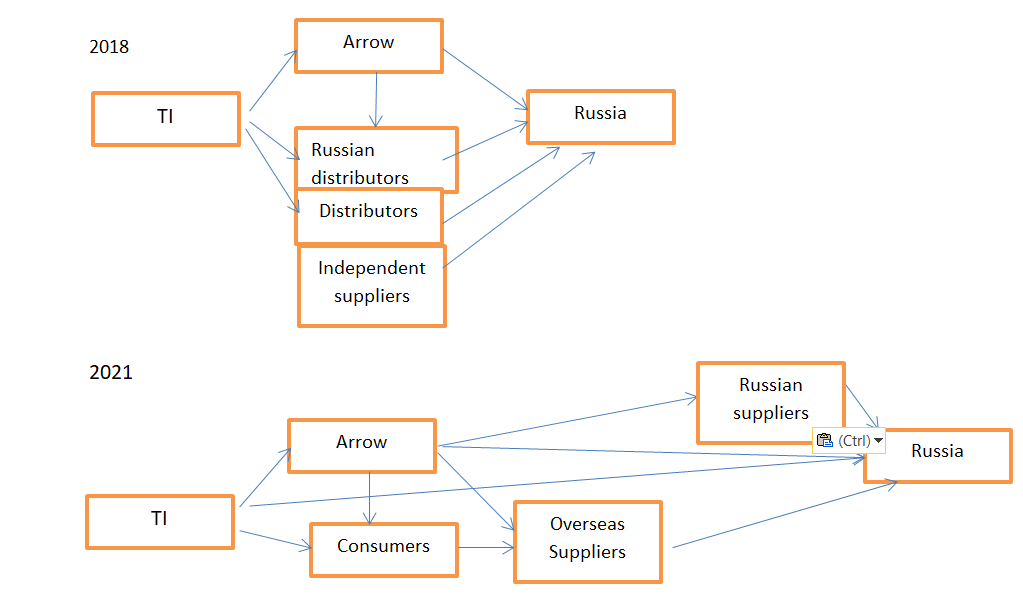
Yesterday, I talked with Arrow representatives on procurement issues, and taking into account information from the article, in 5 minutes I got this picture.
As a scenario for the future, we can introduce the following statistics
During the whole year of 2018, Arrow officially and directly shipped TI products for the amount of 3.3 million USD, and during 2020 – for the amount of almost 12 million USD. Ironically, but it is a fact, exclusively for Russia, it will soon be possible to rename the brand TI to the brand Arrow. The conclusions that I made earlier are incorrect. It is not the representative office that should seize the initiative to promote the brand in Russia, but Arrow. If earlier availability, price and popularity in Russia were determined by a set of factors, now the sales and availability policy in Russia will be determined exclusively by Arrow.
I liked the article. Please put the plus sign in linkedin
The cost of the article with data 500 EUR
Disagree, want to comment, be sure to write.


