The Russian market profile by connector manufacturers
Dear readers, the article contains a lot of figures and data. More than 110 brands are listed, and many brands are part of other brands and companies. I completely admit inaccuracies or mistakes. Also, manufacturers or brands can have endless variations in spelling. Since I am the only one running my website, I simply can’t check all of the 250 manufacturers that supply to Russia, so I only made a comparison based on the exact match of the brand name. If you notice any inaccuracies, please write in the comments under the articles or via feedback. I will check and, if there is data, I will definitely correct it.
Without a doubt, analysis or comparison of connectors is best done by a list of brands. Those whom you consider competitors or from whom you want to win market share, so you will get more accurate data on the required TOR. This article does not have a clear TOR, so the description will be general. The article also does not provide any conclusion on the figures provided.
Since each additional customs code is a real time and material cost, I chose only the most common ones. The data in Table 3 represent only a part of the market of the total market volume of connectors, which is presented from the part of the customs codes indicated in Table 1.
Table 1. Imports by customs codes for 2019.
|
HS code |
Total |
Note |
|
8536901000 |
178510000 |
Connectors and contact elements for wires and cables |
|
8547200009 |
22230000 |
Insulating fittings of plastics, other |
|
8536699008 |
179150000 |
OTHER PLUGS AND SOCKETS FOR A VOLTAGE NOT MORE THAN 1000 V |
|
8538909909 |
116490000 |
Other parts intended exclusively or mainly for equipment of heading 8535, 8536 or 8537 |
|
8536693000 |
38870000 |
other plugs and sockets for printed circuits with a voltage not exceeding 1000 V |
|
8536900100 |
58240000 |
Pre-assembled elements for electrical circuits with a voltage not exceeding 1000 V |
|
8536908500 |
39300000 |
no more than 1000 V. Other electrical equipment for switching or protecting electrical circuits or for connections to electrical circuits or in electrical circuits |
|
8536700004 |
194000 |
Connectors for optical fibers, optical fiber bundles or cables, of copper |
|
Total |
632984000 |
|
In total, these codes were imported to Russia for 632 million usd.
This slice represents pure connector data. For example, I did not delete the supplies for the production of SAMSUNG ELECTRONICS, although these supplies are more Korean than Russian. In some brands, such supplies take up almost 100% of the share, the volume is large, but there is only one client and not a Russian one. There are still direct automobile supplies of “TE CONNECTIVITY”. Supplies to the electrotechnical market have been preserved.
Russian connector market in the context of the world market
At the beginning of the second quarter, a regular reader of my articles sent me data on global sales of connectors for 2018, which fueled my desire to write an article about connectors. I had to work hard to add Russian imports to table 3. As usual, I’ll start with a brief overview of the global connector market.
In total, there are more than 800 manufacturers of connectors in the world. And every year there are new ones, especially in China and other developing countries. Some of them will soon be absorbed by market leaders, who are actively absorbing each other. Over the past 20 years, the list of TOP-100 world leaders in connectors has been updated by 40%.
TOP-100 global connector manufacturers recorded shipments of $61 bn in 2018. This accounted for 92% of the global connector market.
If you divide those billions on the location of the headquarters, it turns out that the companies registered in North America account for 51% of the market of connectors, Europe 12%, Japan 18.5%, Asia 9.9%, and the world factory China account for a modest 4.1%.
How connectors are assigned to end use. Table 2 shows 2018 shipments of connectors from the top 10 manufacturers for each end use case.
Table 2. Top 10 by End-Use Equipment Sector
|
End-Use Equipment Sectors |
2018 |
% Total Market |
|
Computer & Peripherals |
$5,731.1 |
63.4% |
|
Business Office Equipment |
$412.9 |
52.0% |
|
Instrumentation |
$709.1 |
37.1% |
|
Medical Equipment |
$772.6 |
37.7% |
|
Industrial |
$3,237.0 |
39.5% |
|
Automotive |
$12,865.0 |
81.8% |
|
Transportation (non-auto) |
$2,556.8 |
54.7% |
|
Military/Aerospace |
$1,566.6 |
40.7% |
|
Telecom/Datacom |
$9,068.5 |
61.8% |
|
Consumer |
$2,064.7 |
63.4% |
|
Other |
$924.2 |
36.3% |
|
Total |
$39,908.6 |
59.8% |
If we take into account that 90% of the consumption of connectors in the Russian automotive industry comes from direct deliveries from manufacturers, and we make computers on a microscopic scale, compared to the global market, then about a third of the Russian market for end use is outside the world market. I have always noted in articles that global data is generally useless to us, with one exception, when you need to choose a brand you want to distribute. For example, if you want to develop Telecom/Datacom and Industrial, then you may need to pay attention to the brand number H in the line of which Telecom / Datacom takes 20% and Industrial 28%, i.e. there are more balanced brands for this task than for example “LEMO SA” in the line of which Telecom/Datacom takes 5% and Industrial 10%, and Medical Equipment 25%.
Simply selecting a manufacturer by its place in the rating may lead you to a mistake. For example, there are brands that are in the TOP 10 imports to Russia, 90% of which are either direct sales to customers, or the import of representative offices themselves, i.e. direct deliveries to manufacturers.
You can read more about this in my article “Comparing numbers by brand”.
You don’t need to evaluate places, but a combination of factors, including your goals. For example, in connectors, I would assess the following factors: sales locations in Europe and China, sales structure by application, sales structure by classifier, percentage of direct shipments to customers, mandatory analysis of imports to Russia. And only then meet and discuss prices, products, availability.
So, the list of TOP-100 global manufacturers and their import volumes are presented in Table 3.
Table 3.
| Ranked by Region | ||||||||
| Place in the world in 2018 | Manufacturer | 2018 Total, mil usd | Country | Europe | China | Russia 2019. Total, mil usd | Place in Russia | % of global sales |
| Zavod Elekon | Russia | 82,00 | ||||||
| 1 | TE Connectivity | 10304 | North America | 1 | 4 | 39,80 | 1 | 0,39 |
| 39 | WAGO | 277 | Europe | 11 | 44 | 29,03 | 2 | 10,48 |
| Elektrodetal | Russia | 27,70 | ||||||
| 17 | Phoenix | 645 | Europe | 8 | 21 | 25,28 | 3 | 3,92 |
| IEK | Russia | 19,00 | ||||||
| Kopir | Russia | 13,00 | ||||||
| Iset | Russia | 11,30 | ||||||
| Plant Atlant | Russia | 11,10 | ||||||
| 14 | HARTING | 899 | Europe | 5 | 19 | 10,40 | 4 | 1,16 |
| Elektrosoedinitel | Russia | 9,70 | ||||||
| TDM ELECTRIC | Russia | 8,40 | ||||||
| 3 | Molex | 5557 | North America | 4 | 5 | 8,98 | 5 | 0,16 |
| Soedinitel | Russia | 7,40 | ||||||
| DKC | Russia | 6,20 | ||||||
| КВТ | Russia | 5,80 | ||||||
| EKF | Russia | 5,60 | ||||||
| 38 | Weidmüller Interface GmbH & Co. KG | 281 | Europe | 10 | 48 | 5,50 | 6 | 1,96 |
| 4 | Aptiv (FKA Delphi Connection) | 3239 | North America | 3 | 7 | 5,17 | 7 | 0,16 |
| 2 | Amphenol | 7567 | North America | 2 | 2 | 4,78 | 8 | 0,06 |
| 21 | CommScope | 456 | North America | 39 | 29 | 3,66 | 9 | 0,80 |
| DEGSON | China | 3,60 | ||||||
| Snezhet | Russia | 3,20 | ||||||
| 7 | Yazaki | 2692 | Japan | 7 | 11 | 3,21 | 10 | 0,12 |
| 15 | Samtec | 822 | North America | 9 | 16 | 2,48 | 11 | 0,30 |
| KLS | China | 1,90 | ||||||
| 33 | Souriau | 343 | Europe | 17 | 72 | 1,83 | 12 | 0,53 |
| 47 | Lear Corporation | 222 | North America | 28 | 53 | 1,81 | 13 | 0,81 |
| CONNFLY | China | 1,53 | ||||||
| 32 | Glenair | 343 | North America | 26 | 95 | 1,52 | 14 | 0,44 |
| Kaskad | Russia | 1,30 | ||||||
| 60 | Neutrik AG | 124 | Europe | 44 | 58 | 1,32 | 15 | 1,07 |
| 64 | Wieland | 113 | Europe | 42 | 71 | 1,27 | 16 | 1,12 |
| 42 | ODU GmbH & Co. KG | 238 | Europe | 18 | 67 | 1,16 | 17 | 0,49 |
| 11 | Hirose | 1132 | Japan | 38 | 10 | 1,15 | 18 | 0,10 |
| WURTH ELECTRONICS | Europe | 0,98 | ||||||
| HSUAN MAO | China (Тайвань) | 0,92 | ||||||
| Plant Volna | Russia | 0,83 | ||||||
| 9 | J.S.T. | 1475 | Japan | 36 | 8 | 0,76 | 19 | 0,05 |
| 90 | Nicomatic | 58 | Europe | 51 | 91 | 0,73 | 20 | 1,25 |
| 77 | Eaton | 82 | North America | 63 | 68 | 0,60 | 21 | 0,73 |
| 37 | 3M Electronic Solutions Division | 302 | North America | 53 | 34 | 0,54 | 22 | 0,18 |
| 76 | OMRON | 83 | Japan | 71 | 81 | 0,45 | 23 | 0,55 |
| 12 | Sumitomo | 1064 | Japan | 41 | 12 | 0,44 | 24 | 0,04 |
| PULSE ELECTRONICS | North America | 0,44 | ||||||
| 58 | AirBorn | 128 | North America | 68 | 90 | 0,42 | 25 | 0,33 |
| 77 | Positronic Industries | 82 | North America | 65 | 87 | 0,31 | 26 | 0,38 |
| KEYSTONE | North America | 0,30 | ||||||
| 55 | Franz Binder GmbH & Co | 137 | Europe | 33 | 62 | 0,30 | 27 | 0,22 |
| 35 | LEMO S.A. | 335 | Europe | 16 | 59 | 0,29 | 28 | 0,09 |
| 44 | ERNI Electronics GmbH | 234 | Europe | 12 | 65 | 0,27 | 29 | 0,12 |
| 72 | Fischer Connectors | 93 | Europe | 49 | 92 | 0,27 | 30 | 0,29 |
| 63 | Hu Lane Associates Inc | 121 | Asia Pacific | 92 | 33 | 0,25 | 31 | 0,21 |
| 65 | Leoco | 108 | China | 64 | 39 | 0,24 | 32 | 0,22 |
| 81 | Preci-Dip | 74 | Europe | 47 | 89 | 0,22 | 33 | 0,29 |
| 19 | Korea Electric Terminal Co., Ltd. | 492 | Asia Pacific | 90 | 18 | 0,22 | 34 | 0,04 |
| 25 | LOTES Co. Ltd. | 410 | Asia Pacific | 78 | 15 | 0,22 | 35 | 0,05 |
| 24 | Radiall | 421 | Europe | 15 | 40 | 0,21 | 36 | 0,05 |
| 5 | Foxconn (FIT) | 3195 | Asia Pacific | 20 | 3 | 0,19 | 37 | 0,01 |
| 49 | Lumberg Connect GmbH | 171 | Europe | 19 | 69 | 0,17 | 38 | 0,10 |
| 36 | Kostal Kontakt Systeme GmbH | 332 | Europe | 13 | 38 | 0,17 | 39 | 0,05 |
| 29 | Bel Connectivity (Cinch Connectivity) |
371 | North America | 32 | 63 | 0,13 | 39a | 0,03 |
| 20 | AVX/Kyocera | 483 | Japan | 25 | 26 | 0,13 | 40 | 0,03 |
| 85 | Alltop Technology | 64 | Asia Pacific | 95 | 54 | 0,13 | 41 | 0,20 |
| 73 | ERICH-JAEGER | 88 | Europe | 46 | 73 | 0,12 | 42 | 0,13 |
| 66 | Enplas | 107 | Japan | 69 | 56 | 0,11 | 43 | 0,11 |
| 59 | UDE Corp | 126 | Asia Pacific | 88 | 32 | 0,11 | 44 | 0,09 |
| 26 | Belden, Inc. | 404 | North America | 22 | 30 | 0,09 | 45 | 0,02 |
| 84 | Sensata Technologies | 66 | Europe | 60 | 88 | 0,08 | 46 | 0,12 |
| 8 | JAE | 1947 | Japan | 36 | 8 | 0,07 | 47 | 0,00 |
| 10 | Rosenberger | 1214 | Europe | 27 | 14 | 0,07 | 48 | 0,01 |
| 78 | Cvilux Corporation | 81 | Asia Pacific | 93 | 50 | 0,06 | 49 | 0,07 |
| 46 | Smiths Interconnect | 224 | Europe | 34 | 80 | 0,06 | 50 | 0,03 |
| VICOR CORPORATION | North America | 0,06 | ||||||
| 52 | Aces Electronic Co., Ltd | 161 | Asia Pacific | 81 | 24 | 0,05 | 51 | 0,03 |
| 83 | Hummel | 66 | Europe | 52 | 78 | 0,05 | 52 | 0,08 |
| 50 | ept GmbH & Co. | 169 | Europe | 24 | 60 | 0,05 | 53 | 0,03 |
| 13 | JONHON | 910 | China | 66 | 6 | 0,05 | 54 | 0,01 |
| 69 | Conesys | 96 | North America | 59 | 97 | 0,04 | 55 | 0,05 |
| 23 | BizLink Technology Inc. | 433 | Asia Pacific | 29 | 22 | 0,04 | 56 | 0,01 |
| 89 | Conec | 58 | Europe | 55 | 84 | 0,03 | 57 | 0,06 |
| 43 | Yamaichi | 238 | Japan | 35 | 57 | 0,03 | 58 | 0,01 |
| 86 | Omnetics | 63 | North America | 61 | 96 | 0,03 | 59 | 0,05 |
| 51 | AMETEK Interconnect | 168 | North America | 45 | 100 | 0,03 | 60 | 0,02 |
| 34 | ITT Interconnect Solutions | 341 | North America | 30 | 66 | 0,03 | 61 | 0,01 |
| 62 | Teledyne | 123 | North America | 58 | 94 | 0,02 | 62 | 0,02 |
| 22 | Carlisle Interconnect | 451 | North America | 21 | 75 | 0,01 | 63 | 0,00 |
| 6 | Luxshare Precision | 2716 | China | 62 | 1 | no | no | no |
| 16 | Shenzhen Deren Electr. Co., Ltd. | 728 | China | 89 | 9 | no | no | no |
| 18 | Fujikura/DDK Ltd. | 553 | Japan | 40 | 13 | no | no | no |
| 27 | IRISO Electronics | 388 | Japan | 37 | 28 | no | no | no |
| 28 | HUBER+SUHNER | 380 | Europe | 14 | 42 | no | no | no |
| 30 | Corning Inc. | 367 | North America | 43 | 23 | no | no | no |
| 31 | Hosiden | 362 | Japan | 72 | 17 | no | no | no |
| 40 | I-PEX Co., Ltd. | 264 | Japan | 84 | 35 | no | no | no |
| 41 | Winchester Electronics | 245 | North America | 70 | 64 | no | no | no |
| 45 | Foxlink | 232 | Asia Pacific | 91 | 20 | no | no | no |
| 48 | SMK | 196 | Japan | 73 | 36 | no | no | no |
| 53 | Stäubli Electrical Connectors | 144 | Europe | 31 | 79 | no | no | no |
| 54 | Yokowo Company., Ltd | 144 | Japan | 54 | 70 | no | no | no |
| 56 | Telegärtner | 131 | Europe | 23 | 99 | no | no | no |
| 57 | Shenzhen Everwin Precision Tech. Co., Ltd$0.0 | 131 | China | 85 | 27 | no | no | no |
| 61 | Honda | 124 | Japan | 79 | 43 | no | no | no |
| 67 | Speed Tech Corp. | 102 | Asia Pacific | 80 | 31 | no | no | no |
| 68 | Uju Electronics Co., Ltd. | 99 | Asia Pacific | 86 | 37 | no | no | no |
| 70 | Singatron Enterprise Co. Ltd. | 95 | Asia Pacific | 87 | 41 | no | no | no |
| 71 | Autosplice | 94 | North America | 57 | 77 | no | no | no |
| 74 | Jess-Link | 83 | Asia Pacific | 67 | 46 | no | no | no |
| 79 | KEL Corporation | 79 | Japan | 74 | 85 | no | no | no |
| 80 | Advanced Connectek Inc (ACON) | 78 | Asia Pacific | 94 | 45 | no | no | no |
| 82 | Mill-Max Manufacturing Corp. | 68 | North America | 77 | 76 | no | no | no |
| 87 | RIA Connect | 61 | Europe | 48 | 86 | no | no | no |
| 88 | Zhejiang Yonggui Electric Equip | 59 | China | 83 | 47 | no | no | no |
| 91 | Concraft Holding Co Ltd | 57 | Asia Pacific | 82 | 49 | no | no | no |
| 92 | Genesis Technology USA, Inc. | 57 | North America | 96 | 55 | no | no | no |
| 93 | Wieson Technologies | 56 | Asia Pacific | 97 | 74 | no | no | no |
| 94 | P-Two Industries | 54 | Asia Pacific | 98 | 51 | no | no | no |
| 95 | IMS | 52 | Europe | 50 | 82 | no | no | no |
| 96 | Chant Sincere Co., Ltd. | 50 | Asia Pacific | 76 | 61 | no | no | no |
| 97 | C.C.P. Contact Probe | 47 | Asia Pacific | 99 | 52 | no | no | no |
| 98 | Fujitsu Components | 42 | Japan | 75 | 93 | no | no | no |
| 99 | Plastron Precision Co., Ltd | 35 | Asia Pacific | 100 | 83 | no | no | no |
| 100 | TT Electronics | 27 | Europe | 56 | 98 | no | no | no |
Explanations.
- Places in the table are assigned only if the manufacturer is in the world ranking.
- The table is sorted by sales volume in Russia, since this figure is of interest to 99% of visitors.
- How brands without places’ve got into the table, you will learn from the text of the article.
- The last column. What % of Russian imports, according to the codes in Table 1, fall on the manufacturer’s world sales.
This is not the entire import of connectors of the presented brands to Russia, but only by the codes from Table 1.
37 manufacturers from the TOP-100 do not sell their products in Russia or their imports are less than $10,000. It is safe to say that only the CEOs of WAGO, Phoenix, and perhaps Weidmüller see our country in their monthly reports and are ready to adapt the company’s business model to our needs.
Without a doubt, many brands you know are not included in this list. For example, on one of the sites I read the following:
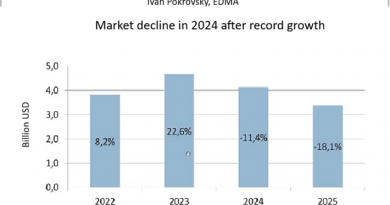
“The largest market share of industrial power connectors in Russia during this period was occupied by IEK products – 25.6 %”.
The figure 25.6, as a share for the whole of Russia, still seems to me overstated, if we consider all imports. Frankly, I did not find the report on the IEK website and, accordingly, did not read it, I could not verify the figure, but most likely a part of the market was taken as a basis there. As I wrote earlier in my articles, almost everyone overestimates their real share. Nevertheless, “IEK” is a good, high-quality brand, but it was not included in Table 3 initially. Why? The Russian brand “IEK” is engaged in placing orders from manufacturers, it itself as a manufacturer does not participate in import, but as a trademark it occupies a very solid 3% share in imports according to the codes of Table 1. This is a very good result. This is several times higher than that of the component market leader “Kompel”. Yes, the products there are different, but as I noted above, we are still considering pure data on codes, without deleting or correcting anything. This is a question of subtle matters. For example, for one article “The market of power sources in Russia”, I received two completely opposite reviews in the mail. One said that the MEAN WELL brand should not be compared to TRACO for the reasons given, and the other said that the MEAN WELL brand should only be compared to TRACO for the reasons given. Paradoxically, they were both right, as they pointed out different uses as reasons.
If you skim through brands similar to “IEK”, you can quickly create Table 4 from memory.
Table 4. Trademarks by import volume in 2019.
|
Trademark |
Total |
|
IEK |
19,0 |
|
TDM ELECTRIC |
8,4 |
|
DKC |
6,2 |
|
КВТ |
5,8 |
|
EKF |
5,6 |
Let me remind you again that this is a trademark, since the manufacturers will be listed in the import list. In total, the trademark has one digit, and for manufacturers it is separate, and some of the manufacturers who make the trademark from Table 4 are included in Table 3. Therefore, when adding these trademarks to the general Table 3, I did not assign them a specific place.
Table 4 shows the brands of the electrical market. Most of the site’s visitors are the management staff of the component market. Let’s try to satisfy their interest.
To do this, I will leave only distributors of electronic components in the import.
If we take the first 22 distributors-import brokers, then the first 20 brands that they supply are shown in Table 5. This is a summary of imports by codes in Table 1, for these brands. These brands are carried by the selected 22 brokers and distributors.
Table 5. TOP brands supplied by distributors and brokers.
|
Brand |
Total |
Rank in Table 3 worldwide |
|
TE CONNECTIVITY |
10063397 |
1 |
|
MOLEX |
5197768 |
3 |
|
NINGBO DEGSON ELECTRICAL |
2734491 |
no |
|
AMPHENOL |
1776098 |
2 |
|
AMP NETCONNECT |
1449331 |
1 |
|
WAGO |
1264988 |
39 |
|
NINGBO CONNFLY ELECTRONIC |
1071303 |
no |
|
WIELAND |
1015540 |
64 |
|
GLENAIR |
957157 |
32 |
|
FISCHER ELEKTRONIK |
940458 |
72 |
|
ODU GMBH & CO. KG |
778122 |
42 |
|
HSUAN MAO |
770822 |
no |
|
SAMTEC |
618067 |
15 |
|
Hirose |
593344 |
11 |
|
J.S.T. |
568735 |
9 |
|
KLS |
560771 |
no |
|
WURTH ELECTRONIC |
447654 |
no |
|
Nicomatic |
433952 |
90 |
|
COMMSCOPE |
412540 |
21 |
|
AIRBORN |
394270 |
58 |
Only 5 brands that account for the main import of connectors sold through Russian broker companies are not shown in Table 3.They are marked with the word “no”. It is especially nice to see TE CONNECTIVITY, DEGSON, CONNFLY, KLS in the table, since the author has been creating mass demand for these brands for many years.
In Table 6, I give a full import of these brands by codes from Table 1 and the volume data is given in Table 3 also without specifying the location.
Table 6. Full import of brands marked with the word “no” in Table 5.
|
Brand |
Total |
|
NINGBO DEGSON ELECTRICAL |
3606592 |
|
KLS |
1920029 |
|
NINGBO CONNFLY ELECTRONIC |
1536683 |
|
HSUAN MAO |
924357 |
|
WURTH ELECTRONICS |
985776 |
For Table 5, I took only the first 20 brands, if we take from 21 places and below, of course, there’d be much more unrecorded brands present at the component market of Russia and not included in the global list of TOP-100 in Table 3. Some of these brands are specified in Table 7.
Table 7. Brands also supplied by distributors and brokers.
|
Brand |
Total |
|
PULSE ELECTRONICS |
439687 |
|
KEYSTONE |
307899 |
|
VICOR CORPORATION |
58222 |
I chose these brands based on the principle “did not work, but heard”. Table 7 shows the full import of the indicated brands by customs codes from Table 1. I also added these three brands to Table 3.
What can I say in the end? Your suppliers are the component market. If you want to have minimal problems with supplies to Russia, choose the brand connectors in Table 5. Of course, if you are such manufacturers as “Bolid” or “Energomera”, you can carry and plan on your own, but if you are a small or medium-sized manufacturer, then availability in warehouses in Russia is important for you.
If we sum up all the figures in Table 3 and subtract the results of Table 4 (trademarks), we get that 175 mn usd is exactly accounted for by the codes in Table 1 for connectors and connectors. To this amount, you can add no more than $15 million for brands that are not listed in Table 3.
In connectors, the rate of supply through distributors is lower compared to microcircuit chips. If we sum up the imports of the broker importers I decoded, in 2019 they accounted for only 48 million imports out of 175 mn. In reality, the percentage is slightly lower, since the percentage of direct supplies and supplies through distributors, even if there are several official distributors, can vary greatly. As an example, here are the Top 5 recipients for a number of brands – Table 8
Table 8. The TOP-5 recipients.
|
Manufacturer |
Type of recipient |
Total |
|
NINGBO DEGSON ELECTRICAL |
Broker |
1744485 |
|
Manufacturer |
521147 |
|
|
Broker |
361817 |
|
|
Broker |
293002 |
|
|
Broker |
290000 |
|
|
KLS |
Broker |
394630 |
|
Manufacturer |
225240 |
|
|
Manufacturer |
220755 |
|
|
Broker |
123753 |
|
|
Manufacturer |
118975 |
|
|
AMPHENOL |
Broker |
915491 |
|
Manufacturer |
516633 |
|
|
Manufacturer |
295778 |
|
|
Broker |
283894 |
|
|
Harness manufacturer and supplier |
173496 |
There are a lot of players in the connector market, so there are very few players like DEGSON, who make most of their supplies through distributors. These are the pearls of the distribution business. All major supplies sooner or later go to direct supplies from the manufacturer. For example, TE CONNECTIVITY is a world leader in the field of automotive connectors, and almost all supplies in Russia in this area go directly to manufacturers.
Therefore, it is very important for connector distributors to immediately discuss the rules of the game with manufacturers: when and under what circumstances direct supplies and compensation are possible. Direct supply, on a large project – it’s only a matter of time, too much competition.
Among Russian manufacturers of connectors, the competition is minimal. Many of them produce strictly defined models for specific consumers. Consider Russian manufacturers in the next section
Manufacturing of connectors in Russia.
In 2019, almost all players have reduced the volume of production of connectors. All Russian companies, without exception, ship almost all of their products to the state-regulated part of the market. The state armament program for 2011 – 2020 is coming to an end, orders for state defense orders are decreasing, and the automotive market is also not growing. Demand from civilian public and private buyers is declining. All this greatly affects the size of the market. Although almost all Russian enterprises are trying to work on import substitution, there is no real progress in the civilian market.
All the manufacturers’ websites I have viewed have long lists of import substitution. I must admit, I did not expect that so many analogs were developed and produced. This may be considered sarcasm, it is not, but I have the impression that we are already producing everything that is at least made in China.
But if we take the dynamics of revenue, it is clear that all these analogues do not enter the civilian market, since the reductions concern not only to the volume of revenue, but also to the number of units produced.
The list of the largest Russian companies that produce connectors includes:
1. Joint Stock company “Zavod Elekon” is the head enterprise of Russia for the development and production of cylindrical connectors for all branches of the defense and civil industry, as well as special electrical connectors for aviation, rocket and space and naval equipment. According to the results of the analysis of the market of Russian connector manufacturers in 2019, the Company’s share is 71 % among competitive types of connectors. By competitive, as I understand it, means similar Russian manufacturers, since I was not able to read this report on the website or on the Internet.
From foreign manufacturers, according to the plant itself, the following are the most active: “TE Conectivity”, “Glenair”, “AMPHENOL”, “Rosenberger”, “MOLEX”, “Huber+Zuhner”, “Souriau”, “LEMO”, “Fisher”, “Odu”, “Harting”, “ITT Cannon”, as well as a number of Chinese companies and Taiwanese enterprises that manufacture electrical connectors.
The production of special electrical products and connectors for the enterprise amounted to 5,312 million rubles (90.2% of the level 2018.). Dynamics of production of connectors by years: 2015 – 6.2 million units, in 2016 to 5.7 million units in 2017 and 4.8 million units, 2018 – 5.0 million units, 2019 – 4,5 million units.
It is very pleasant to read the annual report of “Elekon”, thanks to them, in contrast to the report of the plant “Iset”, which could just as well have not published it.
2. “Elektrodetal” is a leading manufacturer of rectangular connectors. “Elektrodetal” doesn’t publish reports, or I have not found them.
3. “Kopir” plant. The only enterprise where a large share of connectors produced by the plant is civilian products that enter the automotive market. The rest is occupied by the production of military products for State Defense Order. The only company I have reviewed that shows revenue growth for three years in a row, most likely due to an increase in its share in the automotive market.
All these three enterprises are part of the same group and at least two of them belong to the same owners.
Now it is Russia’s largest manufacturing holding for connectors, occupying 71.6% of the market among Russian manufacturers of connectors and connectors of all classes.
4. JSC “Ural Plant of Electric Connectors “Iset” is a specialized Russian enterprise for the development and production of electrical connectors for aviation and space technology.
5. Currently, the share of PJSC “Plant Atlant” in the domestic market for the production of electrical connectors, according to the plant itself, is 9.7%, radio frequency connectors 6.7%, and automotive products 5.5%. This is data from the factory itself. Revenue was 1,316 million, of which 56.4% came from electrical connectors.
6. The production of JSC “Elektrosoedinitel” is focused on the production of highly hermetic electrical connectors based on glass-metal junction for the needs of aviation, space and the Ministry of Defense. It is one of the leading manufacturers of sealed electrical connectors.
7. “Kaskad” is a manufacturer of rectangular connectors for industrial applications and telecommunications.
8. “Snezhet” – today it is a full production cycle plant. It produces electrical connectors that are included in the ECB list and are successfully used in the electronics and military industries. Currently, it is an independent manufacturer of rectangular connectors.
9. “Soedinitel” is the only company founded in the post-Soviet period (1993). Development and manufacture of special-purpose electrical, optical and optoelectronic connectors, as well as sealed connectors.
10. JSC “Plant Volna” produces electric low-frequency connectors for computer equipment, defense and automotive industries, but, according to the information on the website, most of the products are supplied to the automotive market.
11. In Russia there are plenty of other industries.
- Oktyabr Production Association State Enterprise is the only enterprise in Russia with large-scale production of radio frequency connectors that produces a wide range of products with a wave resistance of 50 Ohms. Unfortunately, my request for the volume of output remained unanswered, and although I personally estimate their volume at about 500-600 million rubles, I decided not to include them in my table.
- Irkutsk relay plant is a modern industrial enterprise that specializes in the development and production of switching equipment products. It mainly produces relays, but there are also connectors in the line.
- “Amitron” advertises a wide range of RF connectors. According to the data, the volume of output is very small.
I estimate the production of all small companies like the above at 200 million rubles in 2019.
The market for connectors manufactured in Russia is shown in Table 9.
Table 9. Market of Russian manufacturers and connectors
|
|
million rubles 2017 |
million rubles 2018 |
million rubles 2019 |
million usd, 2019 |
market share |
|
Elekon |
4811 |
5407 |
5312 |
82 |
48,7 |
|
Kopir |
687 |
783 |
840 |
13 |
7,7 |
|
Elektrodetal |
1600 |
2160 |
1665 |
27,7 |
15,3 |
|
Elektrosoedinitel |
669 |
555 |
626 |
9,7 |
5,7 |
|
Plant Atlant |
617 |
717 |
718 |
11,1 |
6,6 |
|
Kaskad |
92 |
88 |
84 |
1.3 |
0,8 |
|
Iset |
830 |
800 |
730 |
11,3 |
6,7 |
|
Snezhet |
292 |
209 |
209 |
3,2 |
1,9 |
|
Soedinitel |
411 |
589 |
477 |
7,4 |
4,4 |
|
Volna |
42 |
38 |
54 |
0,83 |
0,5 |
|
Others |
200 |
200 |
200 |
3,1 |
1,8 |
|
Total, RUB |
10251 |
11546 |
10915 |
100,0 |
|
|
Total, usd |
175 |
183,5 |
168,9 |
Notes
- Unfortunately, the manufacturer “Snezhet” did not respond to my request, so I took their sales for 2019, similar to 2018.
- For some factories, for example, “Elekond”, “Atlant”, reports reflect the real percentage of revenue accounted for connectors, from the rest I found information in different ways or evaluated independently. The amount of revenue that you see in Table 9 is already the total amount for connectors only.
- The estimate in usd is based on the average exchange rate for the current year.
- If you read my articles:
Relay market in Russia
Capacitor market part 2
Analysis of the quartz generator market in Russia
and analyze the total sales for the last three years, according to these families, you will see that the cumulative sales in rubles for Russian enterprises have not changed. The regulated market for connectors, capacitors, relays, and quartz remained unchanged.
In general, everything is the same in the civilian market, but there are tens of thousands of customers, and the birth and death of brands there is a natural process. For a regulated market, everything is more difficult, since the margin of safety is not based on natural market processes.
Again, I have to mention a small nuance. When you are told that a closed regulated market makes up 40% of the total market, this is an honest figure if you take it literally. In reality, this figure is 40% more harmful than useful, since it hides the real state of affairs.
Let me give you an example.
As I wrote above, it seems that we already know how to do everything. At one enterprise, from Table 9, I saw a list of substitution imports that the enterprise makes for PLS, PLD, PBS, PBD, BLS, BLD, PLH, PLHD, DIN41612, D-SUB, PWL, PHU, PWL-R, IDC, HU, WF, etc. It turns out that we do everything and this is all part of 40% of the market.
I found a tender of one JSC from 2019 that makes laser rangefinders for the army, i.e. it produces a lot of things on the laser topic, but I think the tender is being implemented directly for military products.
This JSC bought Russian-made connectors. Their analogs are shown in Table 10 and Figure 1.
Figure 1.–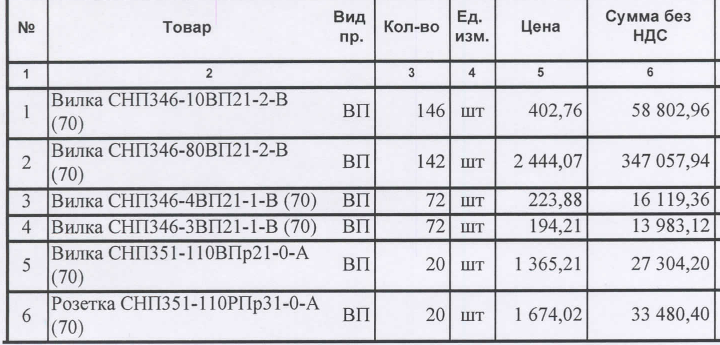
Analogs are registered on the manufacturer’s website in the import substitution section. I summarized all the information in Table 10.
Table 10. Russian connectors, analogs and price comparison.
|
Product |
Analog |
RUB for 1 piece |
Analog in Moscow |
|
СНП351-110РПр31-0-A |
17211102101 |
2000 |
1061 |
|
СНП346-10ВП21-2-в |
PLD-10 |
483 |
1,44_18 |
|
СНП346-80ВП21-2-в |
PLD-80 |
2929 |
7_70 |
|
СНП346-4ВП21-1-в |
PLS-4 |
268 |
0,5_5 |
Notes
- The Price for 17211102101 is given from digikey prices for 25 units from 11.10.2020 and the current exchange rate using the formula 8.44*1.2(VAT)*1.05(supply)*1.3(broker’s profit)*76.77=1061
- The rest of the prices I just looked at efind.ru from manufacturers “Hsuan Mao”, “CONNFLY”, “KLS”, and multiplied by 10 to get the approximate price level of manufacturers such as “Te connectivity”. The first digit is Chinese manufacturers, after the _ sign comes the price of European manufacturers.
I strongly doubt that the PLS-4 connector, as an analog, is made in a metal-ceramic case or for operation in a nuclear reactor. Therefore, the difference in price is obvious. 40% in money, in pieces not more than 10%, in reality it is several times less. This is the main danger of the 40% figure, it gives a false sense of a huge market share, which is not really supported by thousands of customers, products, developments and, most importantly, production volumes in units. That is why I conclude that this is done for the army, otherwise, JSC would have saved at least 70% of the bill amount. This is just the production of analogues under the national security program, I personally can’t call it import substitution. The company clearly does not have enough elementary production in pieces to reach the price level ten times lower than it is now.
There is another example on this topic. I recently read an article that a factory working in the field of components of radio-electronic devices, in pursuance to the President’s message about increasing the market share of civilian products, decided to make electricity meters. Moreover, having no experience and sales, it immediately bought a production line, although the experience of the whole world says that it is absolutely impossible to do this. But the main thing is not that, the main thing is that all these years I thought that the President meant to develop sales of the current products in the civilian market, increasing the overall market share. But the new meter manufacturer directly writes that they produce meters on an imported basis, with the exception of a couple of components. It turns out profanation, i.e. they increase the percentage of civilian products, but not at the expense of electronic components. If everyone does this, what will change? I don’t think that’s what the President wanted.
Now I’m not sure about the word “profanation”, it’s better to let such profanation than PLS-4 for 268 rubles. At least the meters have a chance, but PLS-4 doesn’t.
Once I was asked if I believe that our Russian manufacturers can sell their products in Europe. I said no, because it is impossible to conquer Europe by displacing MOLEX there, if your share in your home market is 0, it is fantastic.
The conquest of Europe begins with the home market.